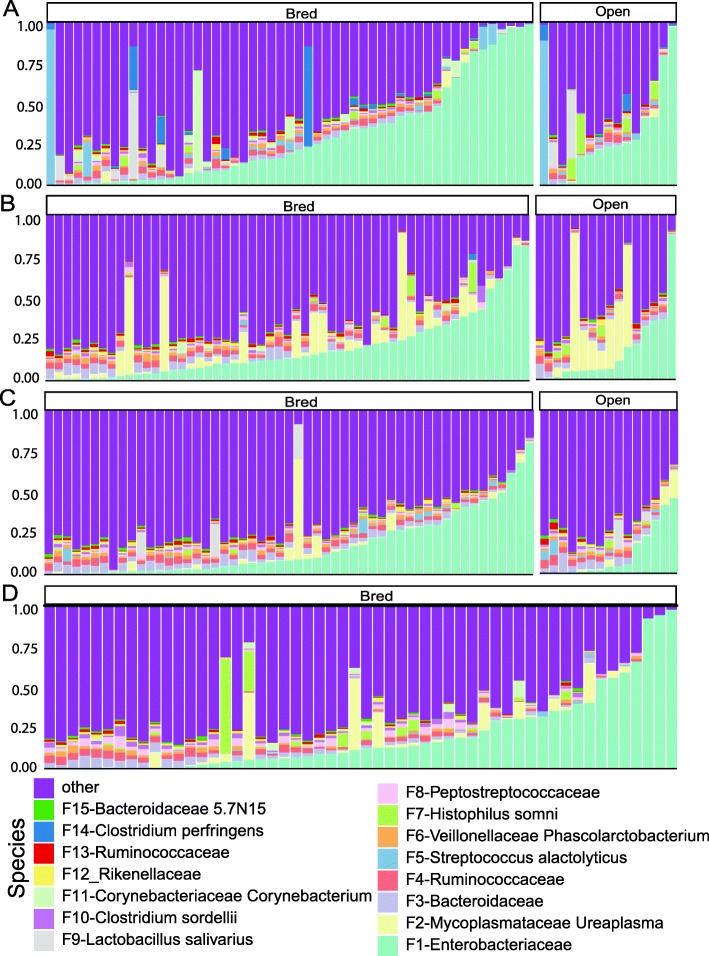
Fig. 3.
Relative abundance of bacterial features of different pregnancy status and stages in the vaginal microbiota of beef heifers. Multi-colored stacked bar graphs represent the relative abundance of the top 15 bacterial features. These features were classified against the Greengenes database and were shown at the deepest known classification. Each panel represents a stage (a: Pre-breeding, b: first trimester, c: second trimester, d: third trimester) and each bar represents a sample. These stages were defined based on the status of the pregnant cattle. Open cattle stayed open throughout the whole experiment

