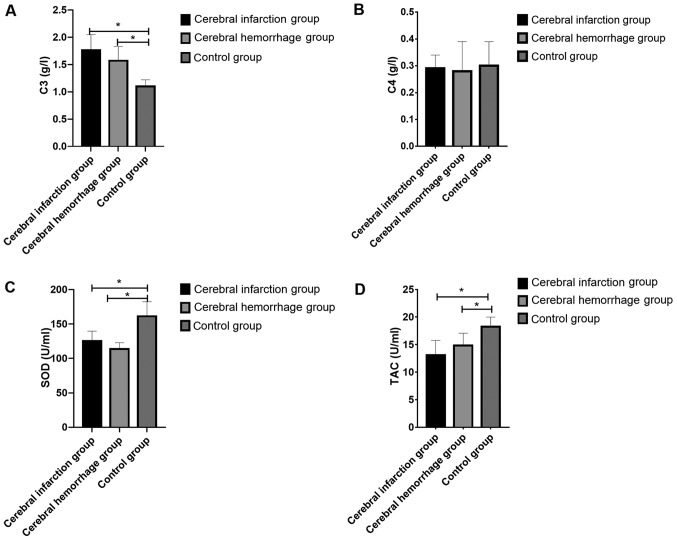
Figure 1.
Determination of serum C3, C4, SOD and TAC levels. (A) The C3 level in the CIG and the CHG was higher than that in the CG. (B) The C4 level in the CIG and the CHG was lower than that in the CG. (C) The SOD level in the CIG and the CHG was lower than that in the CG. (D) The TAC level in the CIG and the CHG was lower than that in the CG. *P<0.05 compared with the CG. TAC, total antioxidant capacity; CIG, cerebral infarction group; CHG, cerebral hemorrhage group; CG, control group; SOD, superoxide dismutase.

