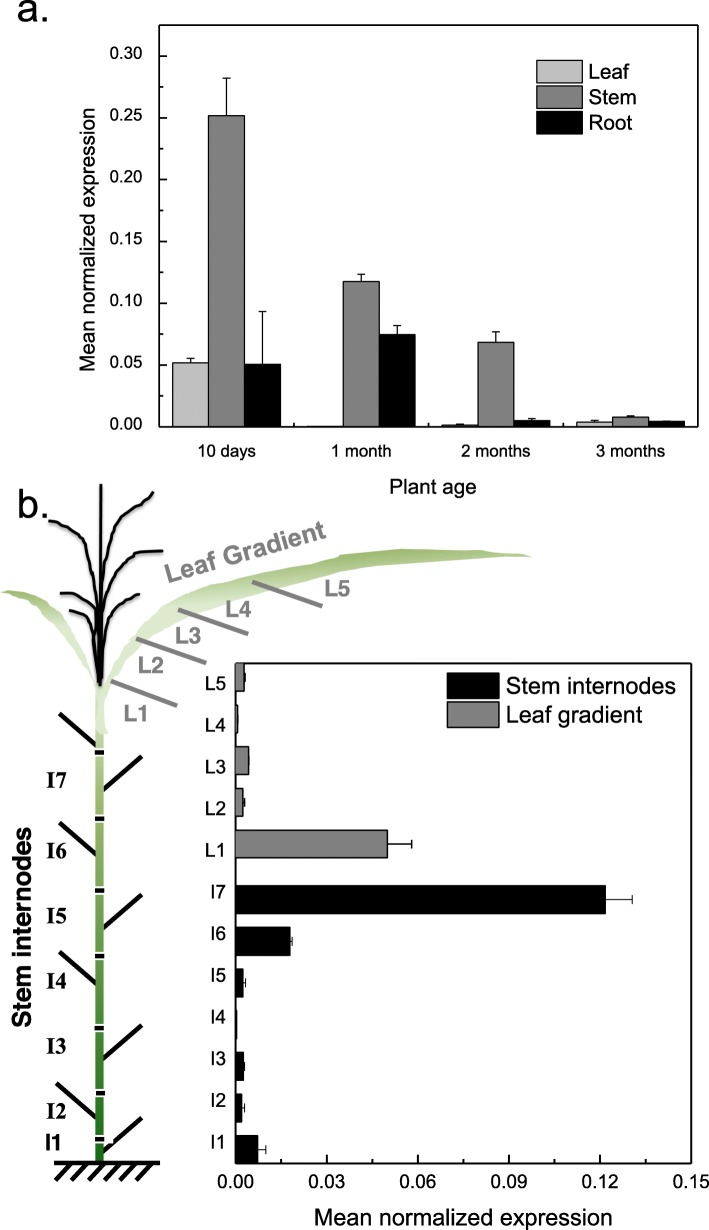
Fig. 2.
Expression pattern of MsLAC1 as quantified by qPCR. Expression pattern in a different tissues of different plant age and b stem internodes and leaf gradient of mature, 6-month-old Miscanthus plants. The cartoon in b displays the sampling mode. Transcript levels were determined by qPCR and normalized with respect to PP2A expression

