Fig. 7.
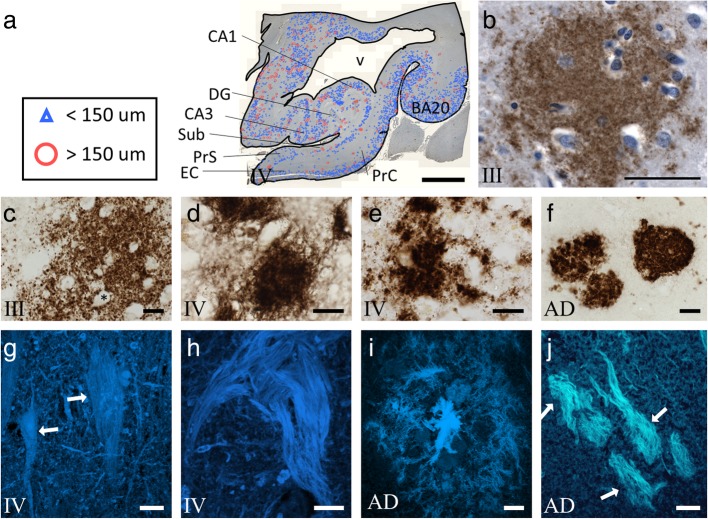
Photomicrographs illustrate Aβ pathology in the MTL of CTE. a Charting of the distribution of 6E10 positive diffuse amyloid plaques (blue and red) superimposed upon the original immunolabeled section from a CTE stage IV case. b MTL sections immunolabeled with 6E10 (brown) and Nissl counter stained (blue) show a diffuse plaque (b) in the inferior temporal cortex (BA20) of a stage III case. c-f Photomicrographs of Aβ1–42 immunolabeling in the PrS of CTE stage III (c), EC (d) and PrS (e) of stage IV, and CA3 from an AD case (f). Note the large amorphous shape of a diffuse plaque fenestrated with blood vessels (black asterisk) in stage III (c) compared to more compact appearing plaques in stage IV (d and e). In contrast, Aβ1–42 plaques appeared as dense compact spheroids in AD (f). g-j Thioflavine S positive NFTs (white arrows) in CA1 (g) and EC (h) in a CTE stage IV case. Note the difference between the smooth and flowing string-like NFTs in CTE (g and h), contrasted with flame-like NFTs found in AD (j). Thioflavine S staining revealed dense core plaques with fibril pathology in the CA1 subfield in AD (i) but not in CTE. Abbreviations: AD, Alzheimer’s disease; DG, dentate gyrus; EC, entorhinal cortex; PrC, perirhinal cortex; PrS, presubiculum; Sub, subiculum; v, ventricle. Scale bars = 5000 μm in (a), 50 μm in (b), 10 μm in (d-f), and 20 μm in (g-j)

