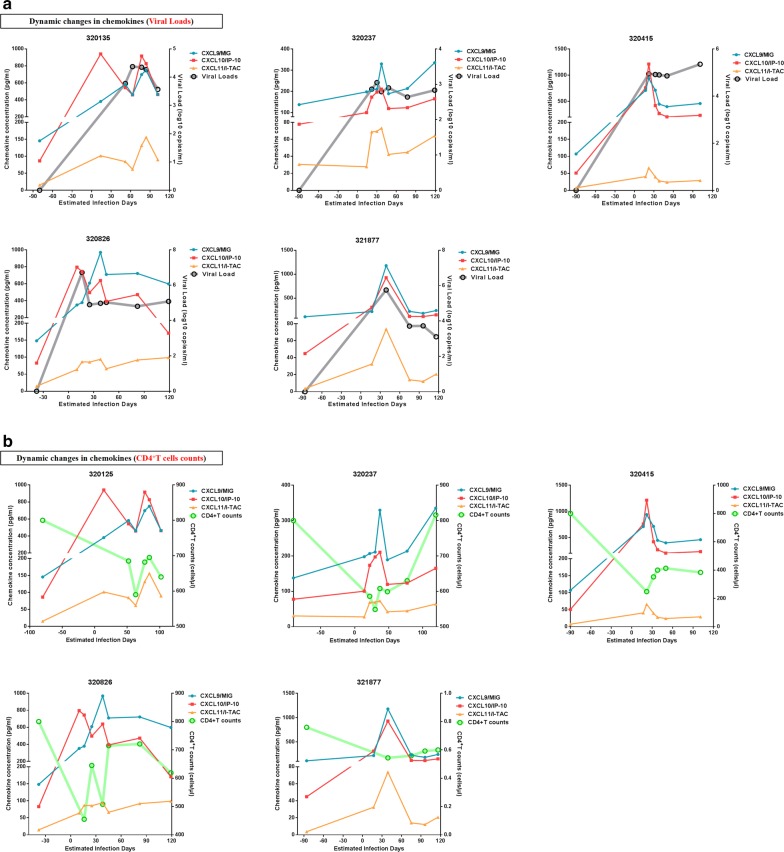
Fig. 4.
Dynamic changes in plasma CXCL9, CXCL10, and CXCL11 levels during PHI. a Dynamic changes in plasma CXCL9, CXCL10, CXCL11, and viral load during PHI in five participants. Blue, red, yellow, and gray lines represent CXCL9, CXCL10, CXCL11, and viral load, respectively. b Dynamic changes in plasma CXCL9, CXCL10, CXCL11, and CD4+ T-cell count during PHI in five participants. Blue, red, yellow, and green lines represent CXCL9, CXCL10, CXCL11, and CD4+ T-cell count, respectively

