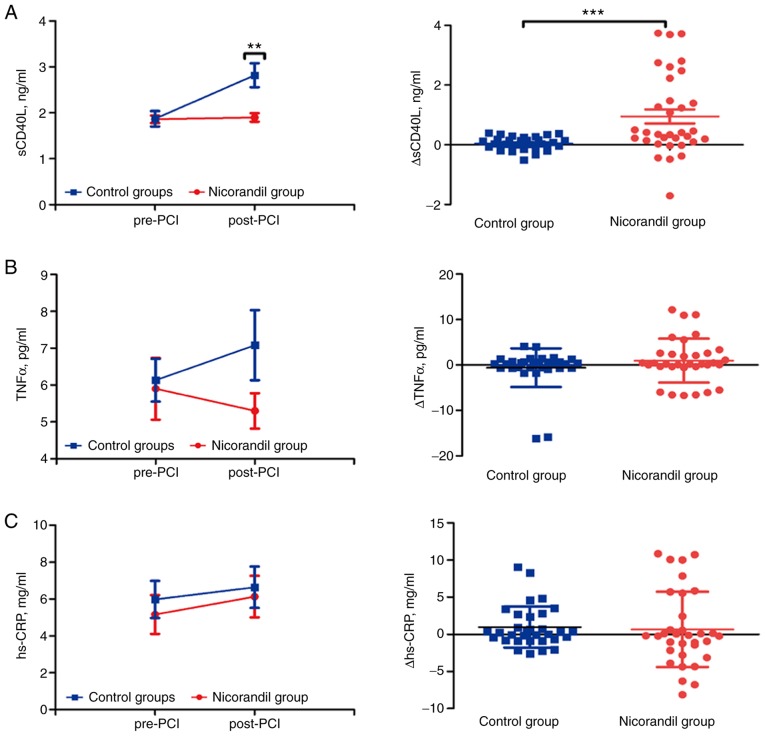
Figure 2.
Dynamics of the inflammatory response pre-PCI and post-PCI, and the difference in values between the two subgroups in the nicorandil and control groups. (A) Levels of sCD40L before and after PCI in the groups and subgroups, and Δ values of sCD40L of post-PCI compared with pre-PCI in the two groups. (B) Levels of TNFα before and after PCI in the groups and subgroups, and Δ values of TNFα of post-PCI compared with pre-PCI in the two groups. (C) Levels of hs-CRP before and after PCI in the groups and subgroups, and different values of hs-CRP of post-PCI compared with pre-PCI in two groups. Values are expressed as mean ± SD; Δ values are expressed as mean ± SD; **P<0.01, ***P<0.001. PCI, percutaneous coronary intervention; sCD40L, soluble CD40 ligand; TNFα, tumor necrosis factor α; hs-CRP, high-sensitivity C-reactive protein.

