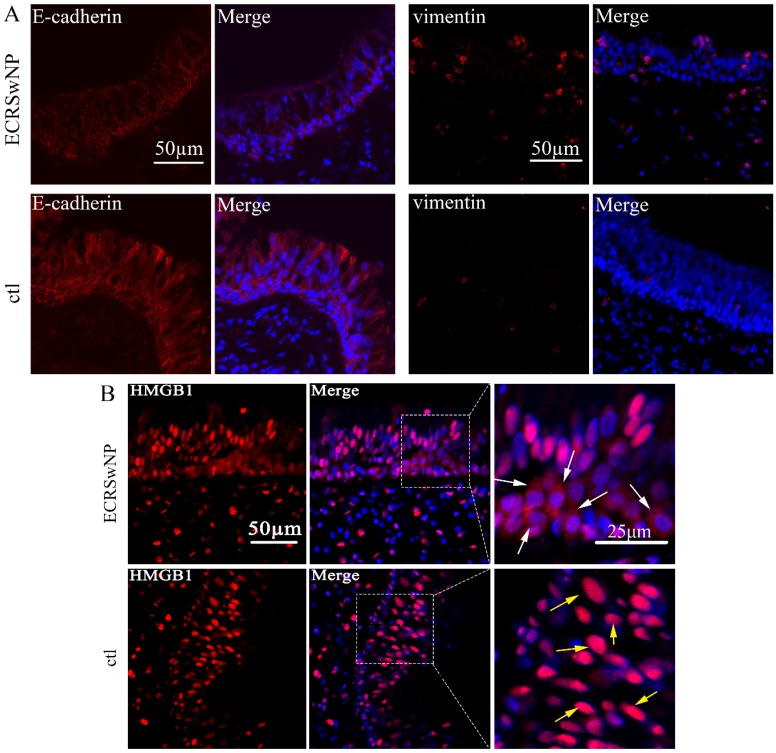
Figure 2.
Expression of E-cadherin, vimentin, and HMGB1 in ECRSwNP and control tissues. (A) Confocal microscopic examination of E-cadherin and vimentin in ECRSwNP and control tissues. Bar, 50 μm. (B) Expression and location of HMGB1. The white arrows showed the location of HMGB1 in the cytoplasm. The yellow arrows showed the location of HMGB1 in the nucleus. Left bar, 50 μm, right bar, 25μm.

