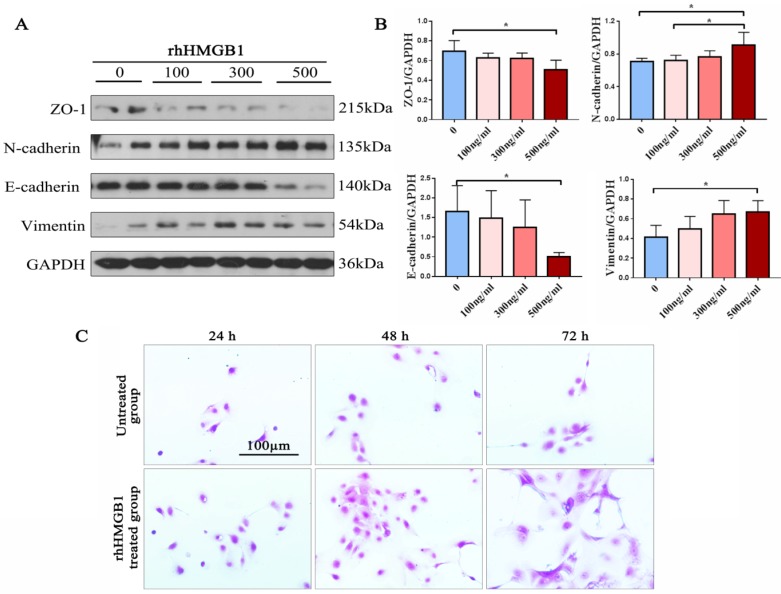
Figure 4.
Expression of EMT markers in preliminary NP cells. (A) Western blot assay was performed to detect the expression of ZO-1, N-cadherin, E-cadherin, vimentin and GAPDH in primary ECRSwNP cells after treatment with dose-dependent rhHMGB1(ng/ml). (B) Quantitative analyses of expression levels of EMT markers in primary ECRSwNP cells. Data were expressed as mean ± SD. *P < 0.05. (C) Cell morphology in the induction group (rhHMGB1: 500ng/ml) and the control group at 24, 48, and 72 h. Cells were stained with crystal violet. Bar, 100 μm.

