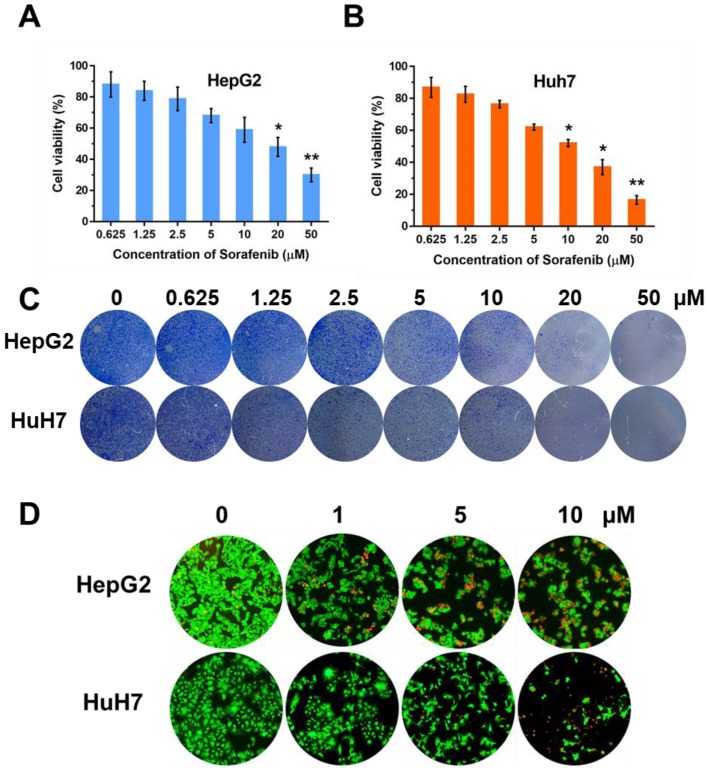
Figure 1.
The effect of sorafenib on cell proliferation. Cell viabilities of HepG2 (A) and Huh7 (B) after treatment of sorafenib; (C) Colony formation of HepG2 and Huh7 cells; (D) Fluorescence stain of living and dead cells. The experiments are repeated for three times. Data are mean ± SD; *P < 0.05, **P< 0.01.

