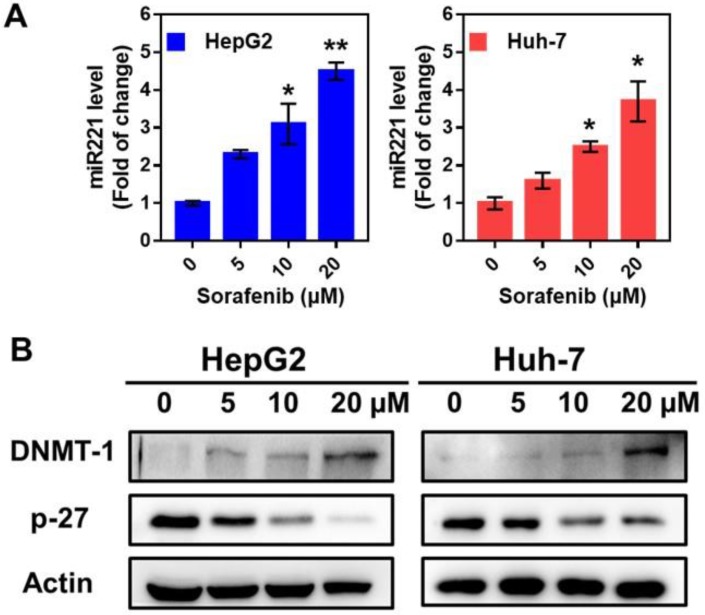
Figure 2.
The impact of sorafenib on miR221 expression and miR-221/p27/DNMT1 signaling pathway. (A) miR221 level after treatment of sorafenib; (B) Western blot of the DNMT1, p27 and β-actin expression. Graphs indicate the miR221 level from 3 independent experiments. Data are mean ± SD; *P < 0.05, **P< 0.01.

