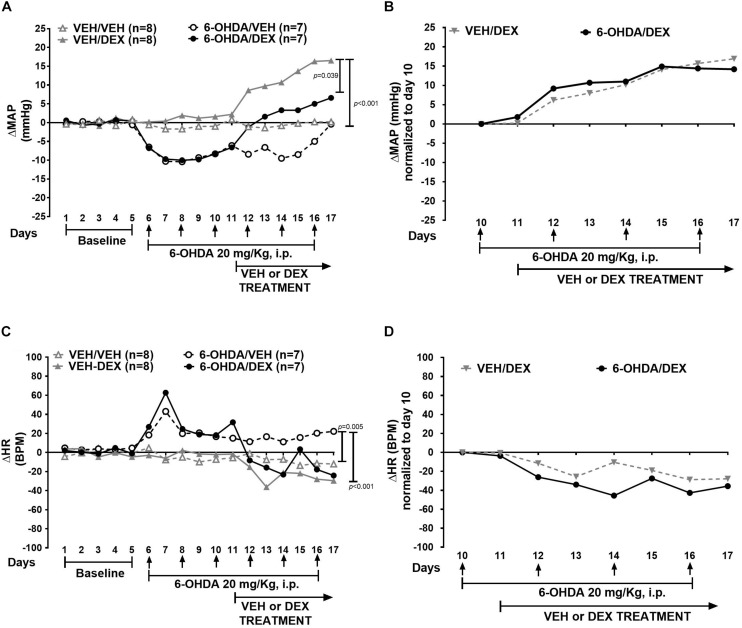
FIGURE 3.
Effect of 6-day 6-OHDA administration on ΔMAP and ΔHR in DEX-induced hypertension. Data represent the median of ΔMAP and ΔHR in animals treated with VEH (gray) and 6-OHDA (black). Top panel shows (A) effect of 6-OHDA and DEX on ΔMAP and (B) ΔMAP normalized to day 10. Bottom panel shows (C) ΔHR and (D) normalized ΔHR to day 10. Comparisons were performed with Friedman Repeated Measures Analysis of Variance on Ranks with Tukey’s post hoc test. Confidence intervals are shown in Supplementary File S3.

