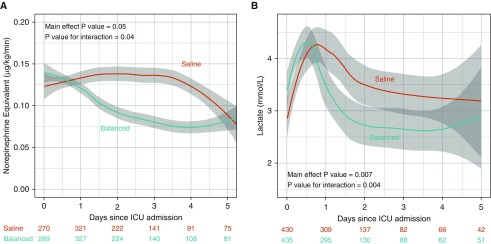
Figure 3.
Vasopressor dose and plasma lactate concentration according to study group. The mean and 95% confidence interval (denoted by gray shading) for (A) dose of vasopressor in micrograms per kilogram per minute in norepinephrine equivalents for patients receiving vasopressors and (B) measured plasma lactate concentration for those with a measured value for the balanced crystalloids group (blue) and the saline group (red) for the first 5 days following ICU admission are displayed using locally weighted scatterplot smoothing. The number of patients with a measured value on each day is displayed for each group.

