Figure 3.
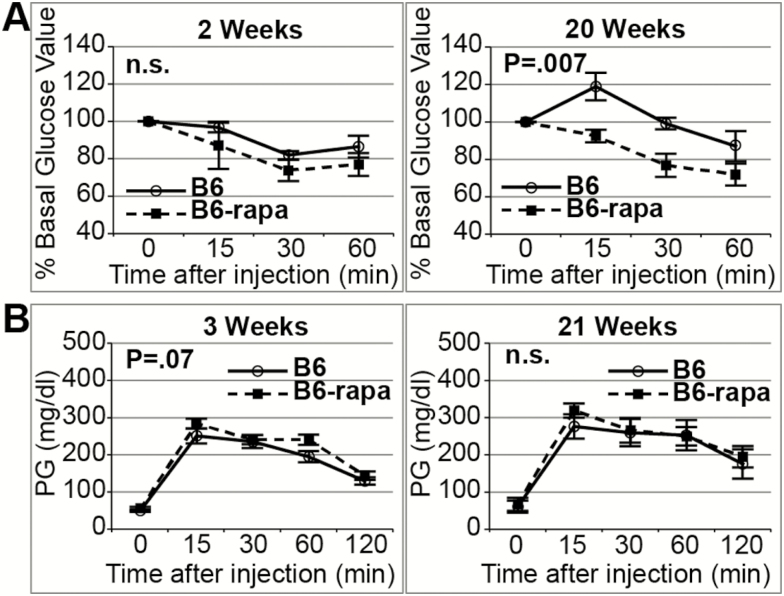
Effect of treatment duration on B6 mice. Values are mean ± SEM. (A) Insulin tolerance test (ITT) at 2 and 20 weeks of treatment in a subgroup of B6 mice (n = 5–6 per treatment) drawn from the mice that were tested after 2 weeks of treatment. The increased insulin sensitivity we observed at 2 weeks of rapa-treatment in B6 mice was sustained after 20 weeks of treatment (main effect of treatment, p = 0.005; main effect of time, n.s.; interaction of treatment with time, n.s., two-way analysis of variance (ANOVA) for area under the curve [AUC] %). (B) Glucose tolerance test (GTT) in the same subgroup of B6 mice, tested after 3 weeks and 21 weeks of treatment. The rapamycin-induced delayed glucose clearance we observed at 3 weeks of treatment was indicated as a trend in this smaller sample size (nominal effect for the treatment at 3 weeks, p = 0.07); this trend was not altered with treatment duration (no interaction of treatment with time) even as the AUC increased moderately with time (15%, p = 0.05, two-way ANOVA for AUC).

