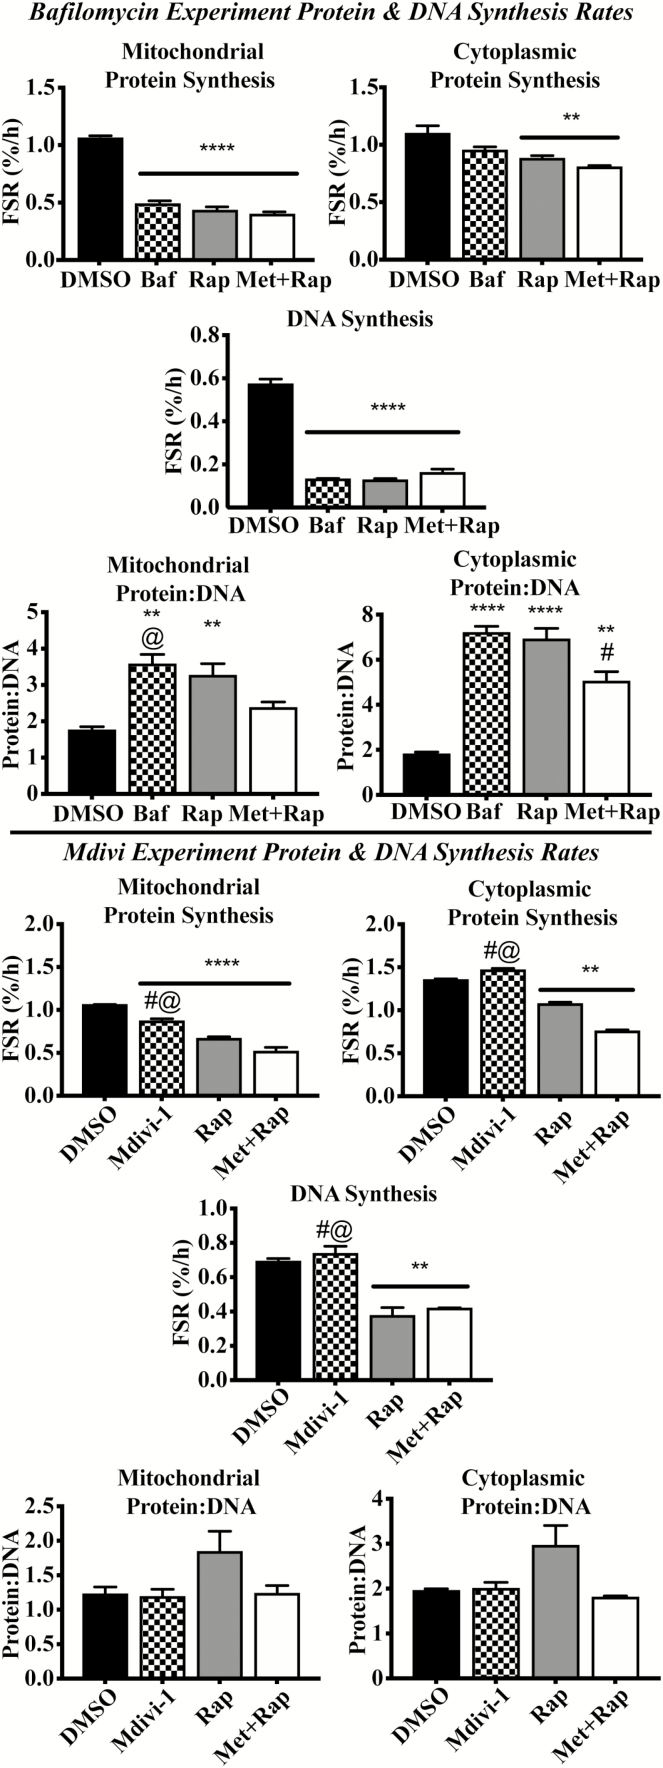
Figure 2.
Contributions of autophagy and mitochondrial fission to Rap and Met + Rap effects on protein synthesis, DNA synthesis, and protein:DNA. The top portion of the figure reports data from synthesis experiments during autophagic inhibition with Baf. This includes 24-h mitochondrial protein synthesis rates, cellular DNA synthesis rates, mitochondrial protein:DNA synthesis, cytoplasmic protein synthesis rates, and cytoplasmic protein:DNA synthesis. The bottom portion of the figure presents the data from synthesis experiments during Mdivi treatment including mitochondrial protein synthesis rates, cellular DNA synthesis rates, mitochondrial protein:DNA synthesis, cytoplasmic protein synthesis rates, and cytoplasmic protein:DNA synthesis. *p < .05 compared with DMSO, **p < .01 compared with DMSO, ***p < .001 compared with DMSO, and ****p < .0001 compared with control. #p < .05 compared with corresponding Rap treatment. @p < .05 compared with corresponding Met+Rap treatment.

