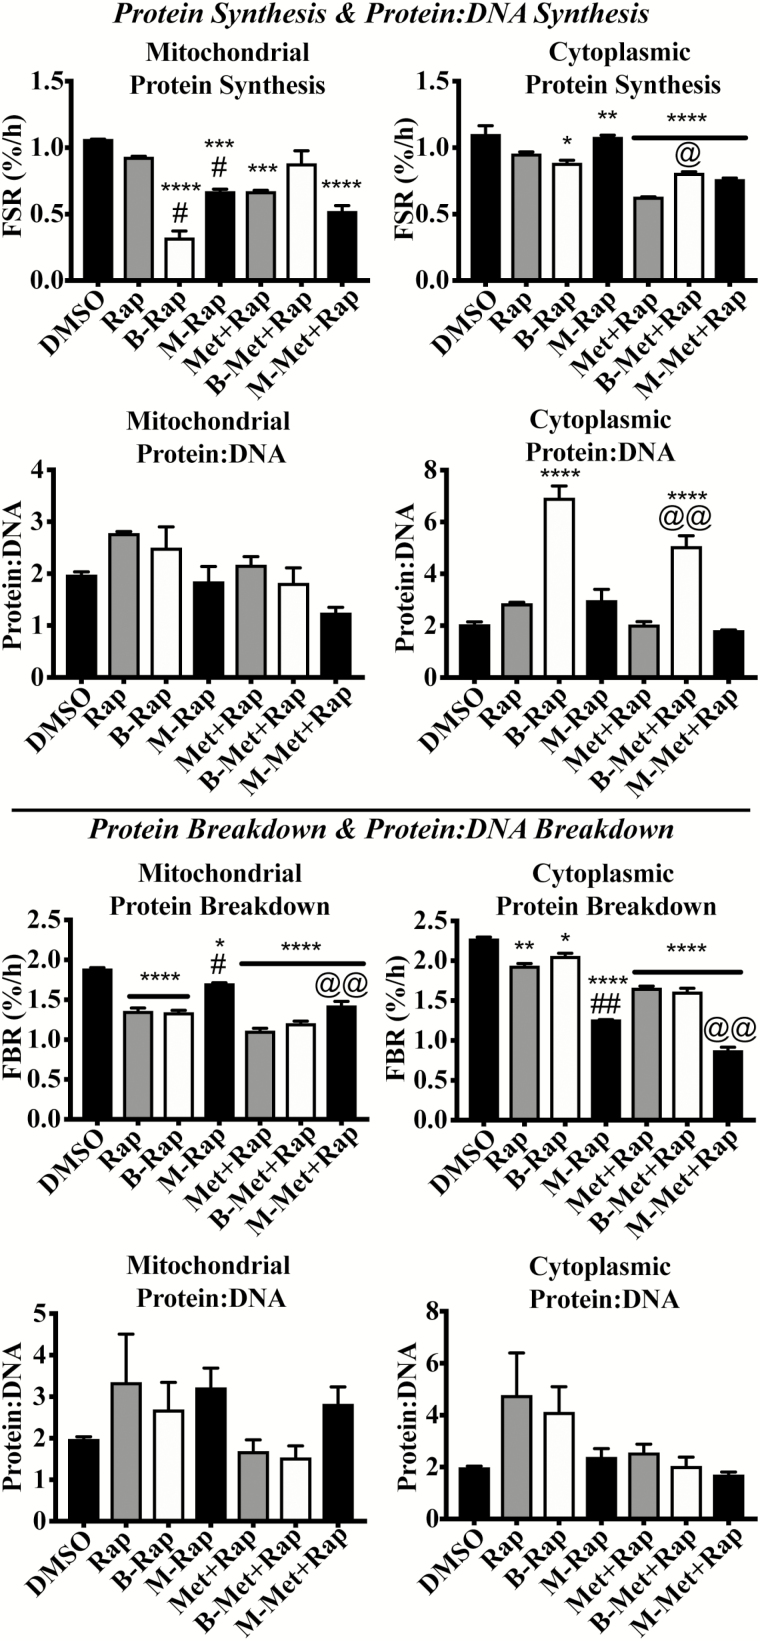
Figure 3.
Inhibition of autophagic flux does not influence mitochondrial protein:DNA, but inhibition of mitochondrial fission does. The data in the current figure provide comparisons across all three synthesis experiments (top four panels) and all three breakdown experiments (bottom four panels). (A) Twenty-four-hour mitochondrial protein synthesis rates, (B) 24-h cytoplasmic protein synthesis rates, (C) 24-h mitochondrial protein:DNA synthesis, (D) 24-h cytoplasmic protein:DNA synthesis, (E) 24-h mitochondrial protein breakdown rates, (F) 24-h cytoplasmic protein breakdown rates, (G) 24-h mitochondrial protein:DNA breakdown, and (H) 24-h cytoplasmic protein:DNA breakdown. *p < .05 compared with DMSO, **p < .01 compared with DMSO, ***p < .001 compared with DMSO, and ****p < .0001 compared with control. #p < .05 compared with corresponding Rap treatment. @p < .05 compared with corresponding Met+Rap treatment. @@p < .01 compared with corresponding Met+Rap treatment.

