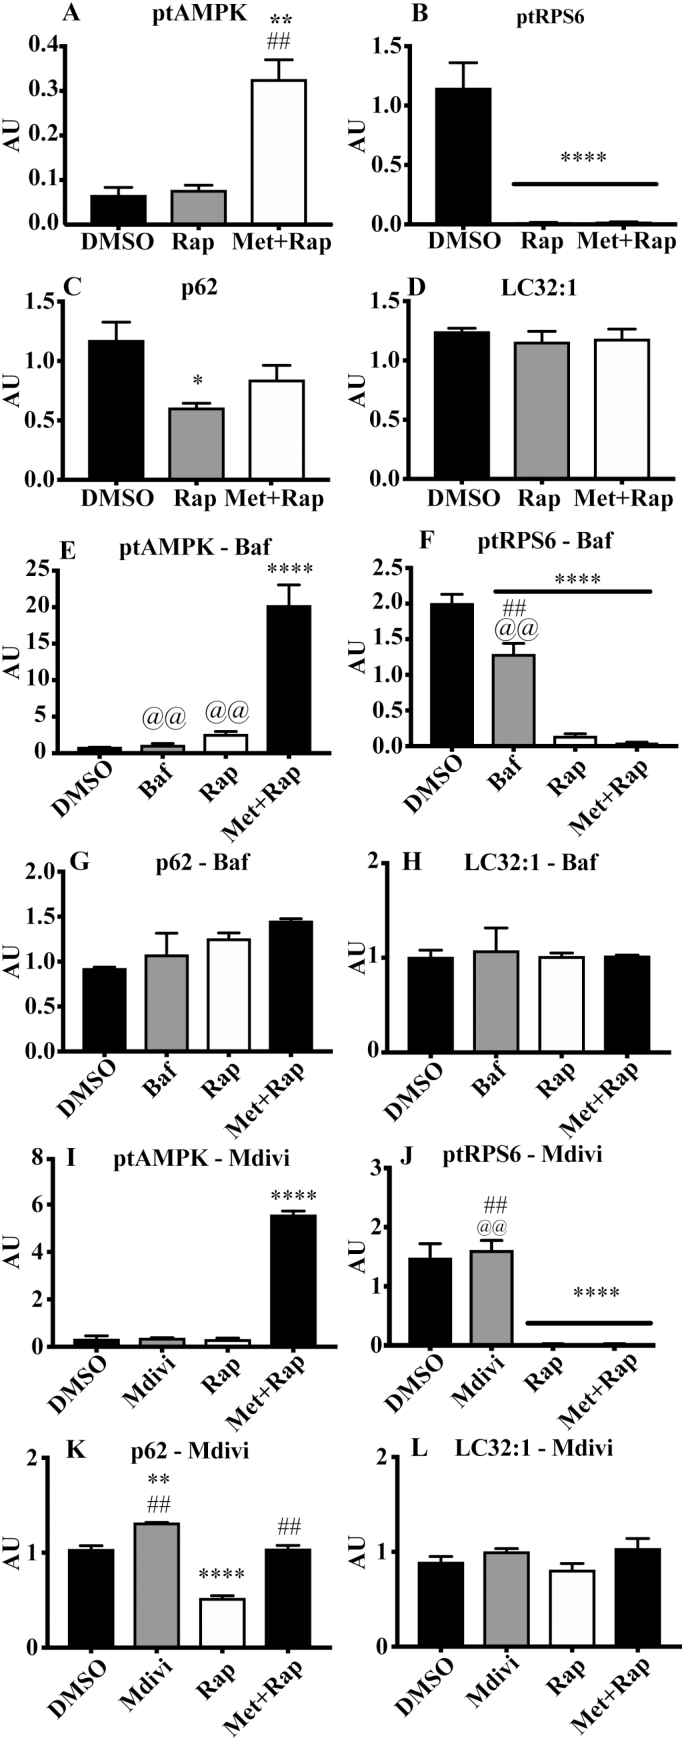
Figure 4.
Protein signaling associated with life span-extending treatments. Quantified immunoblot values from the Rap and Met+Rap only experiment (A–D), the autophagy inhibition experiment (E–H), and the mitochondrial division inhibition experiment (I–L). (A) phosphorylated:total AMPK, (B) phosphorylated:total RPS6, (C) p62 protein content, (D) LC32:1 protein content, (E) phosphorylated:total AMPK, (F) phosphorylated:total RPS6, (G) p62 protein content, (H) LC32:1 protein content, (I) phosphorylated:total AMPK, (J) phosphorylated:total RPS6, (K) p62 protein content, (L) LC32:1 protein content. *p < .05 compared with DMSO, **p < .01 compared with DMSO, ***p < .001 compared with DMSO, and ****p < .0001 compared with control. ##p < .01 compared with corresponding Rap treatment. @@p < .01 compared with corresponding Met+Rap treatment.

