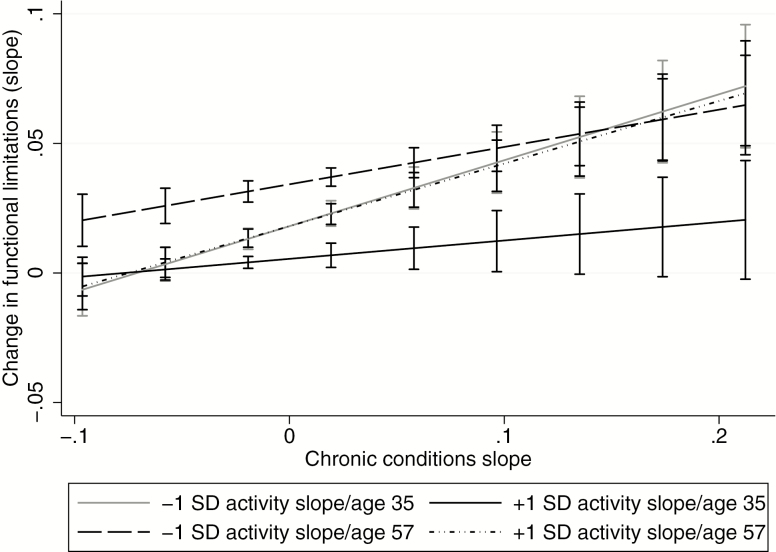
Figure 3.
Relationship between change in chronic conditions (mean-centered) and change in functional limitations as a function of rate of decline in physical activity (mean slope ± 1 SD) and baseline age (average age ± 1 SD). The values on y-axis represent slope of change in functional limitations over time. The values on x-axis represent rate of change in chronic conditions over time. Age 35 and age 57 represent 1 SD below and above the average baseline age, respectively. Error bars are 95% confidence intervals.

