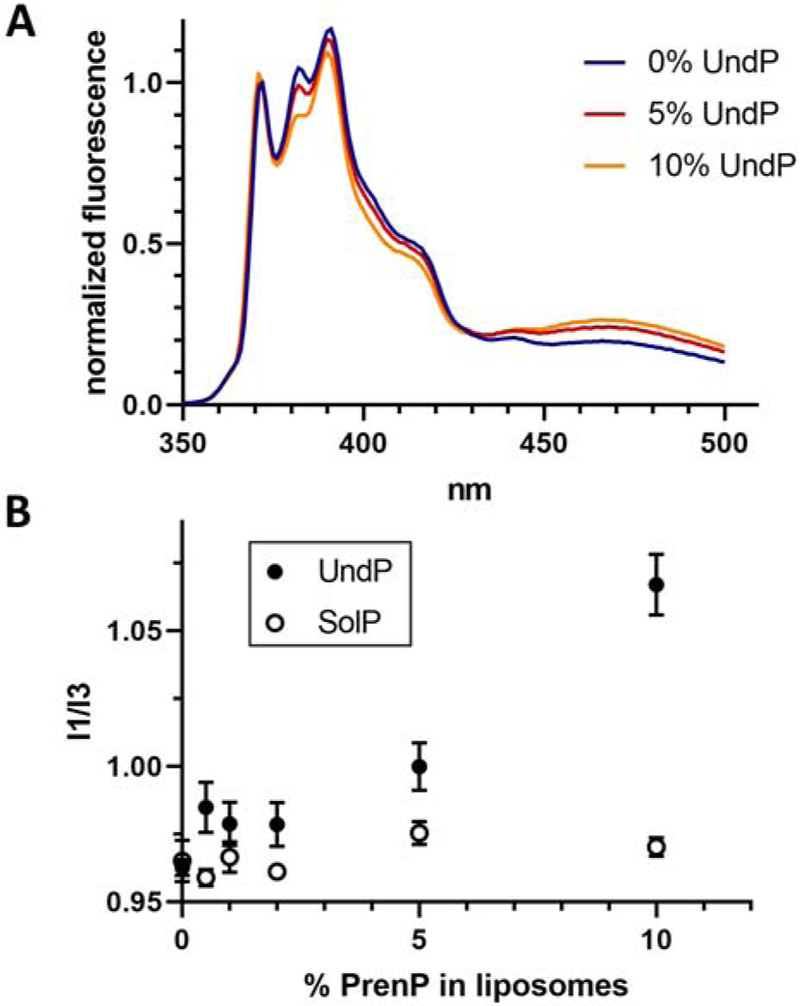
Fig. 6 – Pyrene fluorescence reflects changes in membrane environment.

A. Fluorescence spectra of pyrene in liposomes composed of POPE/POPG and increasing concentrations of UndP. Representative data is shown normalized to fluorescence at 372 nm.
B. The ratio of between the first (372 nm) and third (382 nm) vibrionic peaks of pyrene increases with increasing UndP concentration but is not affected by the presence of SolP. Error bars are given for mean ± SEM, n = 4-8.
