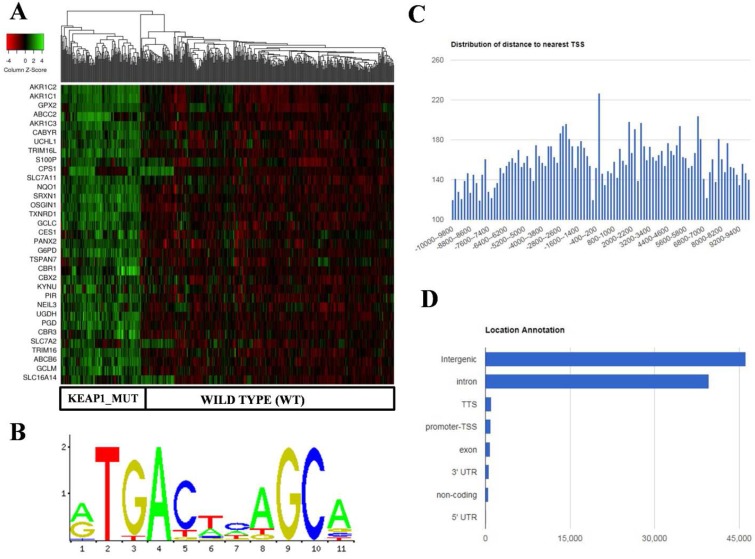
Figure 2.
Identification and in silico analysis of KEAP1 Mutation Specific Gene Cluster (KMSGC) in TCGA-LUAD. (A) Heat map showing the overexpression of KMSGC in KEAP1 mutated LUAD tumors as compared with the WT counterparts. (B) Description of the NRF2-ARE JASPAR database matrix used for the PWM-Scan in silico analysis. (C) Distribution of the number of NRF2 binding sites within the 10 kb upstream and downstream of the promoter Transcription Starting Site (TSS). (D) Bar chart of the genomic location distribution of NRF2 binding sites obtained from ChIPseek tool. The X-axis shows the genomic location and Y-axis shows the number of NRF2 binding sites.

