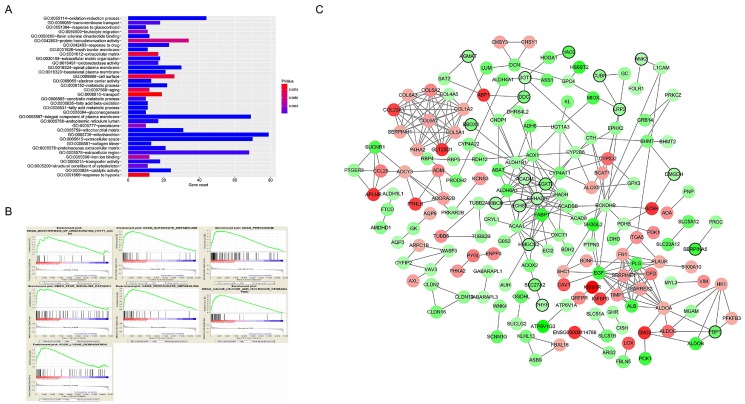
Figure 3.
Functional enrichment and protein-protein interaction (PPI) network. The x-axis displays the amount of gene and the y-axis displays the GO terms. The -log10 (p value) of each term is colored following the legend. The intensity of the color in each node is proportional to gene expression compared to non-tumor samples (down-regulation in green and up-regulation in red). Network hub genes identified by WGCNA are represented by the nodes with bold circle.

