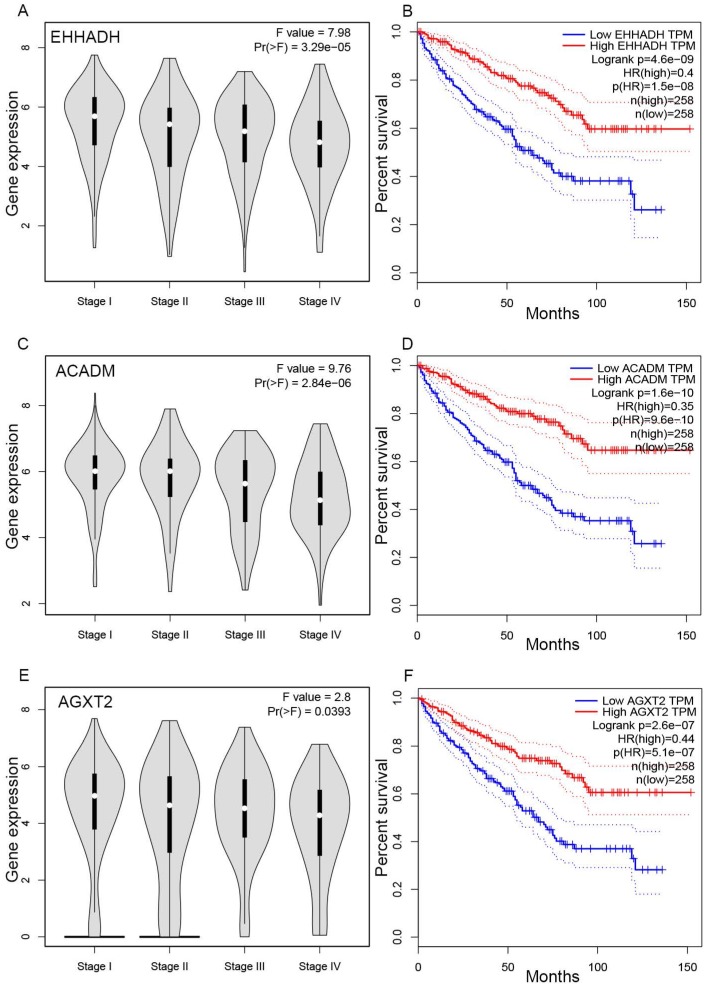
Figure 4.
Validation of hub genes. Panels A, C and E show the correlation of EHHADH, ACADM and AGXT2 expression with the pathological stage of ccRCC, respectively (based on microarray data of TCGA). Panels B, D and E show survival analyses of EHHADH, ACADM and AGXT2 genes in the TCGA data set, respectively.

