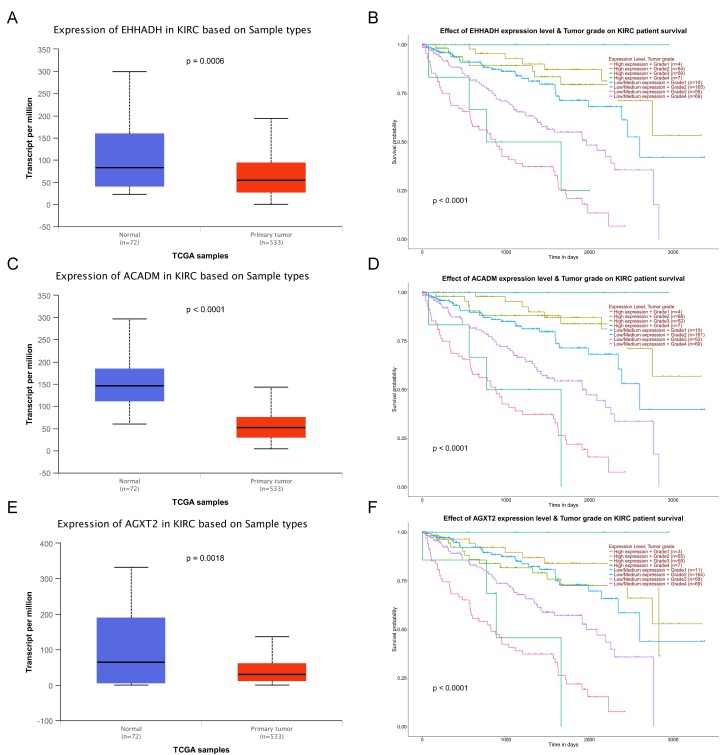
Figure 6.
Validation of expression and survival analysis of three hub genes expression combined with tumor grades in TCGA database. Panels A, C and E show the mRNA expression of EHHADH, ACADM and AGXT2 in ccRCC tissues compared to normal kidney tissues based on TCGA. Panels B, D and F show survival analyses of EHHADH, ACADM and AGXT2 genes expression combined with tumor grades in the TCGA data set, respectively.

