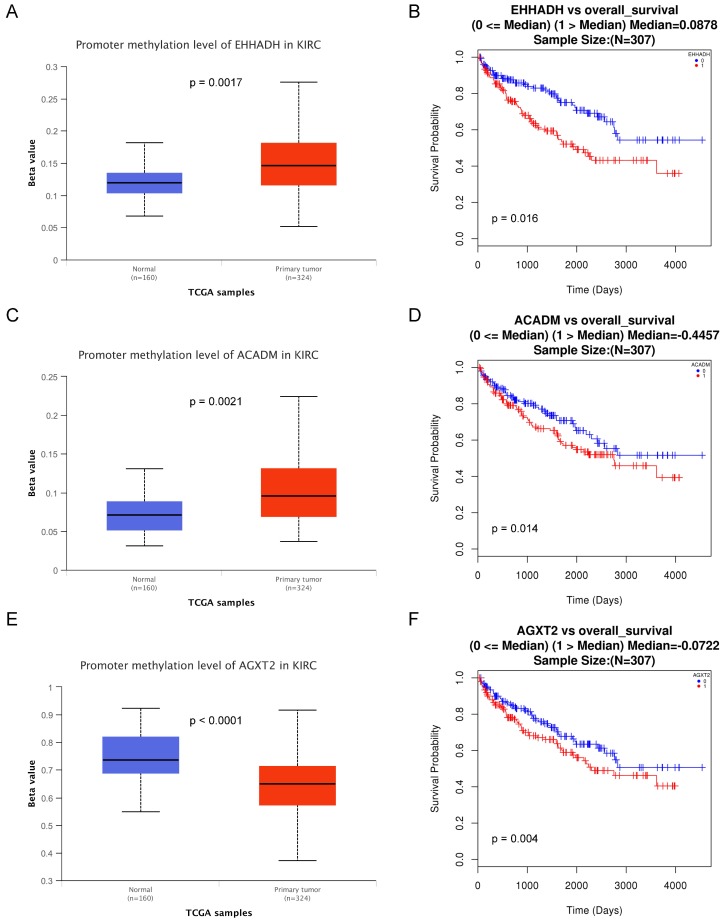
Figure 7.
Methylation status and survival analysis of three hub genes. Box plot showing the methylation levels of the three genes, using data from the TCGA database. The x-axis shows the number of the normal samples and ccRCC samples. The y-axis shows beta value of gene methylation which were shown in Figure 7A, C and E. The Kaplan-Meier survival curve was plotted. It revealed that the overall rates of survival for the patients with 2 hyper-methylated genes (EHHADH and ACADM) and 1 hypo-methylated gene AGXT2 were significantly lower, which were shown in Figure 7B, D and F.

