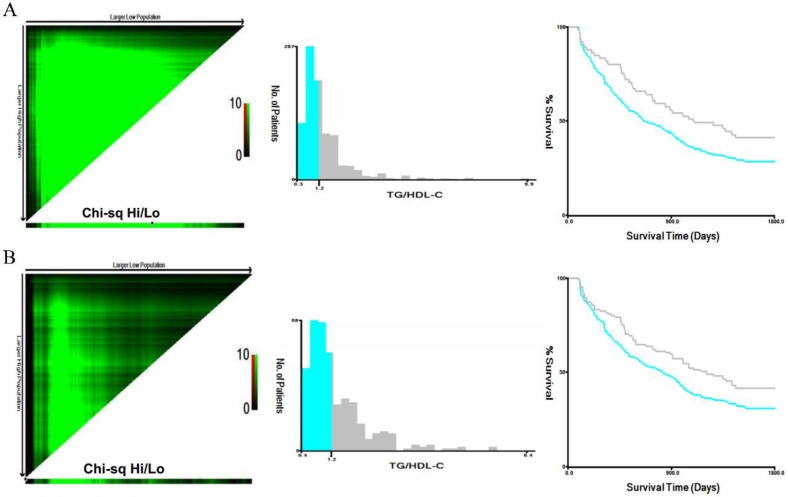
Figure 2.
Analysis of TG/HDL-C using X-tile. The black circles highlight the optimal cutoff values which are presented in histograms in the training (A) and test (B) cohorts. Survival curves of TG/HDL-C in the training and test (B) cohorts. The high TG/HDL-C group had higher 5-year mortality rates than the low group in the training cohort of gastric cancer patients (P<0.001).

