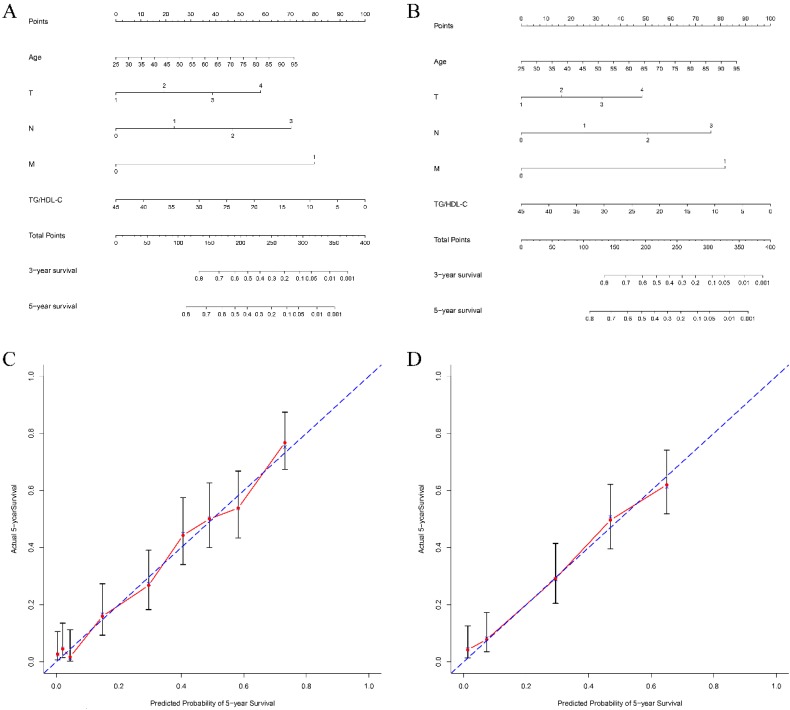
Figure 3.
Nomograms of patients with gastric cancer to predict 5-year overall survival. Locate the TG/HDL-C on the respective axis; draw a straight line up to the Points axis to determine how many points toward 5-year overall survival the patient receives for the TG/HDL-C; repeat this process for other variables; add the points and locate this number on the Total points axis; and draw a straight line down to find the patient's estimated risk of 5-year overall survival. The c-indexes for the training and test cohorts of patients are 0.732 (A) and 0.725 (B), respectively. Calibration curves for overall survival, which are representative of predictive accuracy, for the training (C) and the test cohorts (D). The 45-degree reference line represents a perfect match between predicted and observed values.

