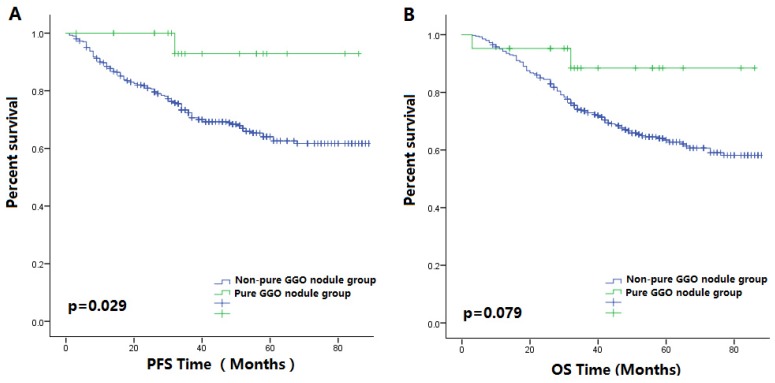
Figure 4.
(A) The Kaplan-Meier survival curve for PFS between patients with pure GGO nodules and patients with other lung cancer nodules after surgery in the female subgroup (P value = 0.029). (B) The Kaplan-Meier survival curve for OS between patients with pure GGO nodules and patients with other lung cancer nodules after surgery in the female subgroup (P value = 0.076).

