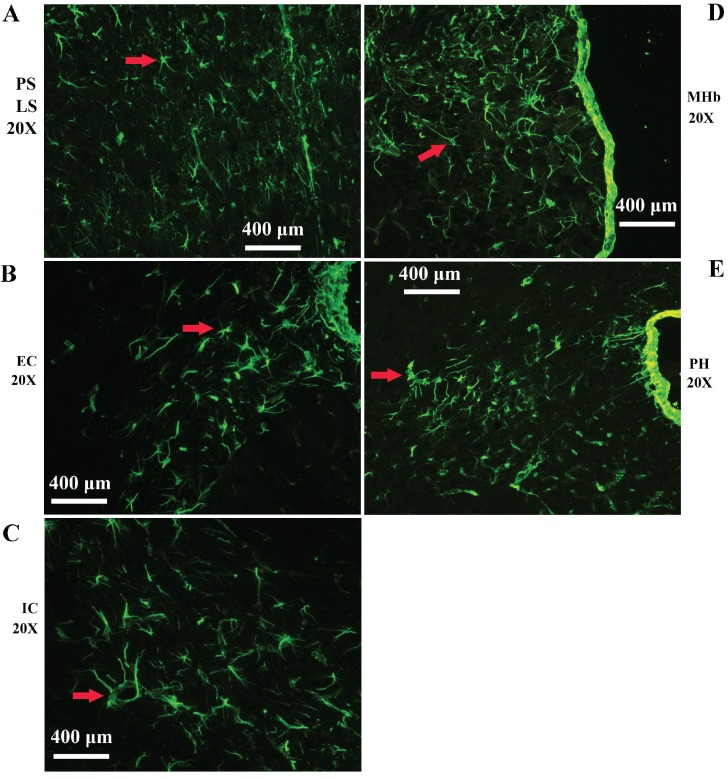
Figure 4.
Representative images of VPCs distribution in different regions of periventricular structures in adult WT mice. A The VPCs distribution in LV. VPCs in LV mainly distributed in LS. B The VPCs distribution in EC. C The VPCs distribution in IC. D The VPCs distribution in MHb. E The VPCs distribution in PH.

