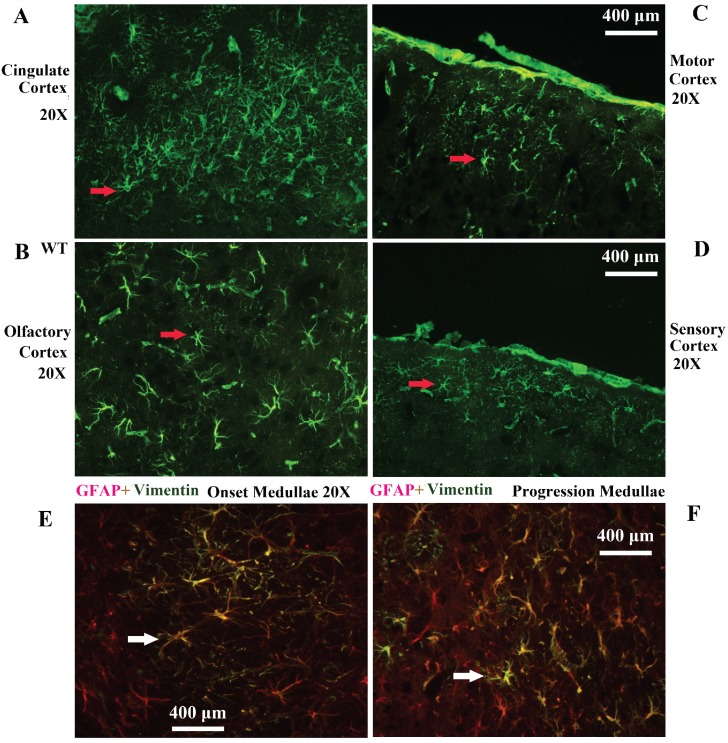
Figure 6.
Representative images of VPCs distribution in different regions of cerebral cortex in adult WT mice. A The VPCs distribution in the cingulate cortex. B The VPCs distribution in the olfactory cortex. C The VPCs distribution in the motor cortex. D The VPCs distribution in the sensory cortex. Representative Images of vimentin and GFAP double labeled immunofluorescent staining in the cerebrum (E, F). E Representative image of vimentin and GFAP double labeled immunofluorescent staining in the medullae at the onset stage of Tg(SOD1*G93A)1Gur mice. F Representative image of vimentin and GFAP double labeled immunofluorescent staining in the medullae at the progression stage of Tg(SOD1*G93A)1Gur mice. All vimentin positive cells were labeled by GFAP, which indicated that all vimentin cells were astrocytes.

