Figure 7.
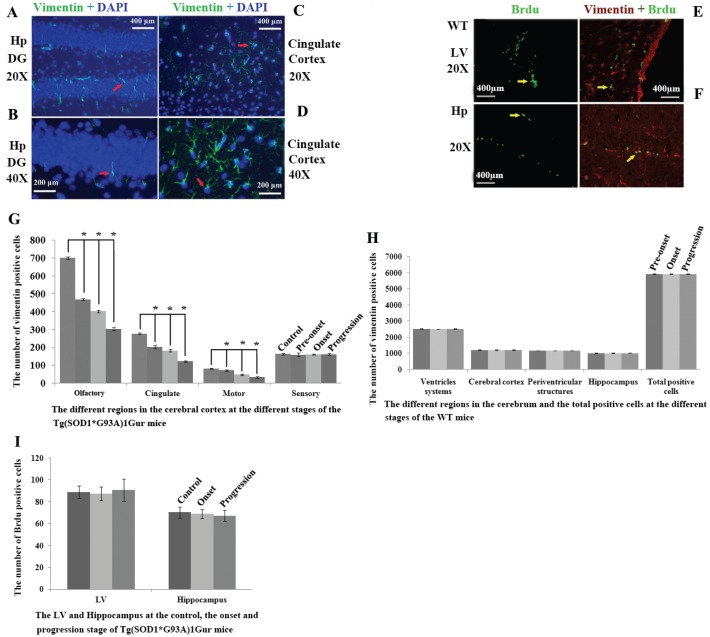
Representative images of vimentin expression in neural cells of cerebrum. A Representative images of vimentin expression in neural cells of hippocampus DG at amplifying 200. B Representative images of vimentin expression in neural cells of hippocampus DG at amplifying 400. C Representative images of vimentin expression in neural cells of cingulate cortex at amplifying 200. D Representative images of vimentin expression in neural cells of cingulate cortex at amplifying 400. All vimentin expressed in the extranuclear. Representative images of vimentin and Brdu double labeled immunofluorescent staining in cerebrum (E, F). E Representative image of vimentin and Brdu double labeled immunofluorescent staining in LV at amplifying 200 in WT mice. F Representative images of vimentin and Brdu double labeled immunofluorescent staining in the hippocmpus at amplifying 200 in WT mice. In the cerebrum, only less than 20% of VPCs were doubly labeled by Brdu in LV and hippocampus, other regions almost weren't found their double labeling. Results indicated that only fewer VPCs have the proliferation ability. Distribution features of VPCs in the different regions of cerebrum at the different stages in adult WT and Tg(SOD1*G93A)1Gur mice (G-I). G The comparison of VPCs number in different regions of cerebral cortex at different stages in Tg(SOD1*G93A)1Gur mice. The VPCs number significantly decreased following with the progression of disease from pre-onset, onset to progression stages in the olfactory, the cingulate and the motor cortex compared with controls. The VPCs number didn't significantly change in the sensory cortex. H The comparison of VPCs number in different regions of cerebrum at different stages in WT mice. The VPCs number didn't significantly change in different regions of cerebrum at different stages in WT mice. I The comparison of VPCs number in different regions of LV and hippocampus at different stages in Tg(SOD1*G93A)1Gur mice. The VPCs number in LV and hippocampus didn't significantly change at onset and progression stages of Tg(SOD1*G93A)1Gur mice compared with controls. Results indicated that only VPCs number in the cerebral cortex significantly decreased following with the disease progression, other regions didn't significantly change. Control mice were age-matched non-transgenic normal C57BL/6 mice, their age were 60-70 days, 90-100 days and 120-130 days respectively. WT mice were C57BL/6 SOD1 wild-type mice.

