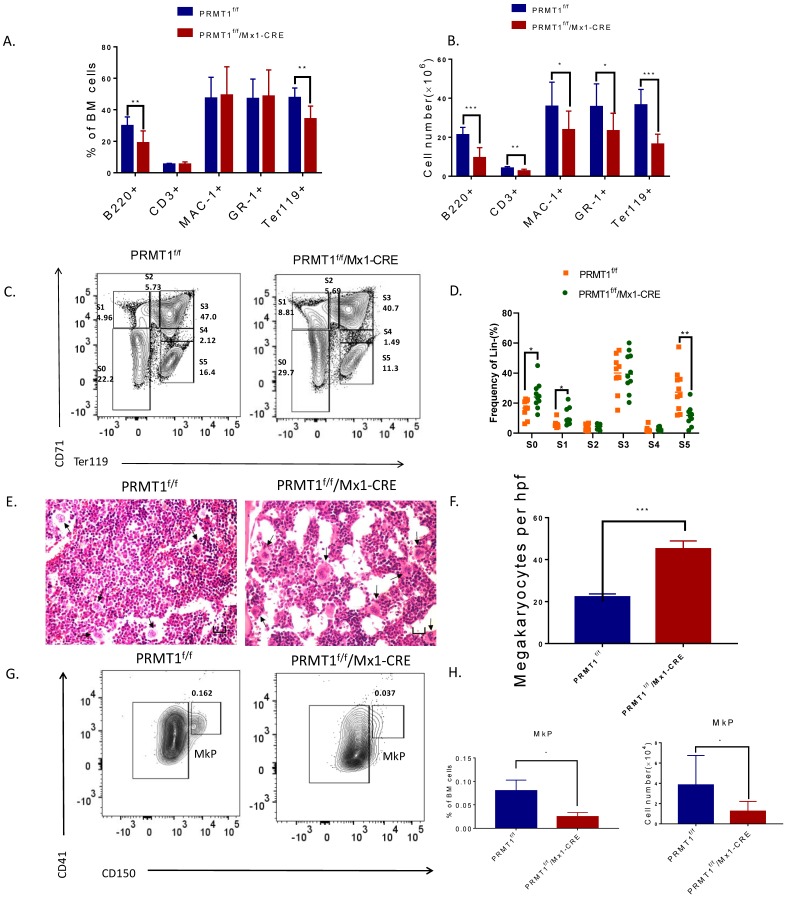
Figure 2.
Loss of PRMT1 affects terminal hematopoiesis differentiation. (A) Frequency of CD3/B220, Mac1/Gr1 and Ter119 population in PRMT1f/f/Mx1-CRE and PRMT1f/f mouse BM cells (n=10). **p<0.01. p values were determined by Mann-Whitney U tests. (B) Number of CD3/B220, Mac1/Gr1 and Ter119 population in PRMT1f/f/Mx1-CRE and PRMT1f/f mouse BM cells (n=10). The absolute number of each subpopulation is calculated through multiply total BM cell number by BM percentage. *p<0.05, **p<0.01, ***p<0.001. p values were determined by Mann-Whitney U tests. (C) Representative FACS plots showing various erythroid progenitor subsets defined by the expression of Ter119 and CD71 in PRMT1f/f/Mx1-CRE and of PRMT1f/f mouse BM analyzed by flow cytometry. (D) Representative FACS plots showing gating strategy and the frequency of each phenotypic erythroid subset (S0-S5) in Lin- BM (n=10).*p<0.05, **p<0.01. p values were determined by Student's t test. (E) H&E staining of the femur section of PRMT1f/f/Mx1-CRE and of PRMT1f/f mice, megakaryocytes are marked with arrows (scale bars, 100µm). (F) Number of megakaryocytes per high power field (hpf) in the BM evaluated in PRMT1f/f/Mx1-CRE and PRMT1f/f mice (n=5). ***p<0.001. p value was determined by Student's t test. (G) Representative FACS plots showing gating strategy and frequency of MkP populations from PRMT1f/f/Mx1-CRE and of PRMT1f/f mouse BM. (H) Frequency and numbers of MkP in total BM cells (n=5). *p<0.05. p value was determined by Student's t test.

