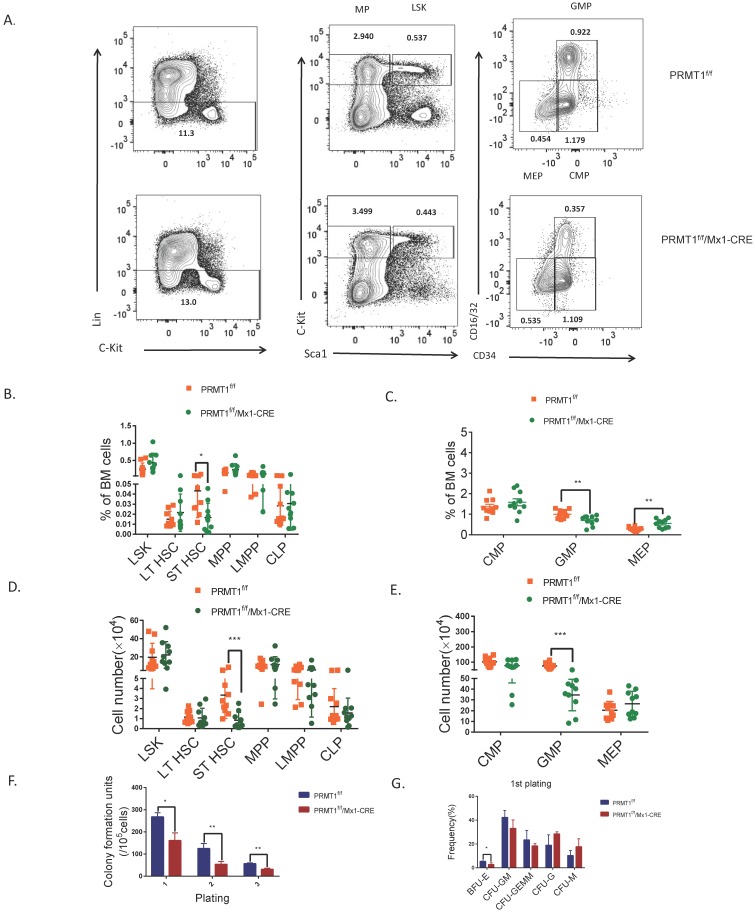
Figure 3.
PRMT1 deletion results in adult mouse HSPCs reduction. (A) Representative FACS plots showing gating strategy and frequency of phenotypic populations including LSKs, MPs, CMPs, GMPs and MEPs from PRMT1f/f/Mx1-CRE and of PRMT1f/f mouse BM. (B) Frequency of LSK, LT-HSC, ST-HSC, MPP, LMPP and CLP populations in PRMT1f/f/Mx1-CRE and of PRMT1f/f mouse BM (n=10). *p<0.05. p value was determined by Student's t test. (C) Frequency of CMP, GMP and MEP subsets in PRMT1f/f/Mx1-CRE and of PRMT1f/f mouse BM (n=10).**p<0.01. p value was determined by Student's t test. (D) Number of LSK, LT-HSC, ST-HSC, MPP, LMPP and CLP populations in PRMT1f/f/Mx1-CRE and of PRMT1f/f mouse BM (n=10). **p<0.01. p value was determined by Mann-Whitney U tests. (E) Number of CMP, GMP and MEP subsets in PRMT1f/f/Mx1-CRE and of PRMT1f/f mouse BM (n=10). ***p<0.001. p value was determined by Mann-Whitney U tests. (F) Colony-forming progenitor (CFU) assays were performed using PRMT1f/f/Mx1-CRE and PRMT1f/f mouse bone marrow cells. CFU- number was shown. Cells were replated over 2 rounds of weekly successive replating (P2, P3). Performed in duplicate from 3 independent experiments.*p<0.05, **p<0.01. p values were determined by Student's test. (G) Percentage of BFU-E, CFU-GM, CFU-GEMM, CFU-G and CFU-M colonies at 1st plating. *p<0.05. Performed in duplicate from 3 independent experiments. p value was determined by Student's test.

