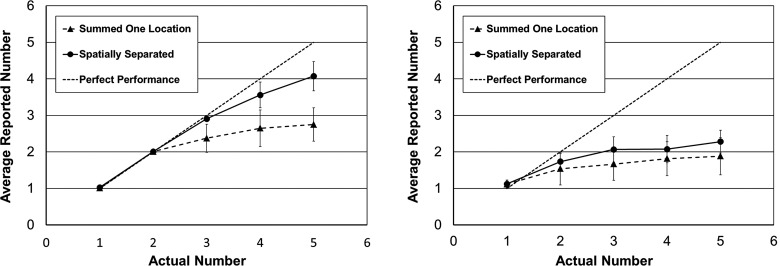
FIG. 7.
(Left) The relationship between the mean and plus/minus one standard deviation of the reported number and the actual number of speech sounds (six listeners, speech stimuli) for experiment IV. Solid line and circles for spatially separated sound sources, and dashed line and triangle for all words co-located at the same loudspeaker. The dotted diagonal line represents perfect performance. (Right) Same relationships as shown in the (left) panel but for the tonal stimuli.

