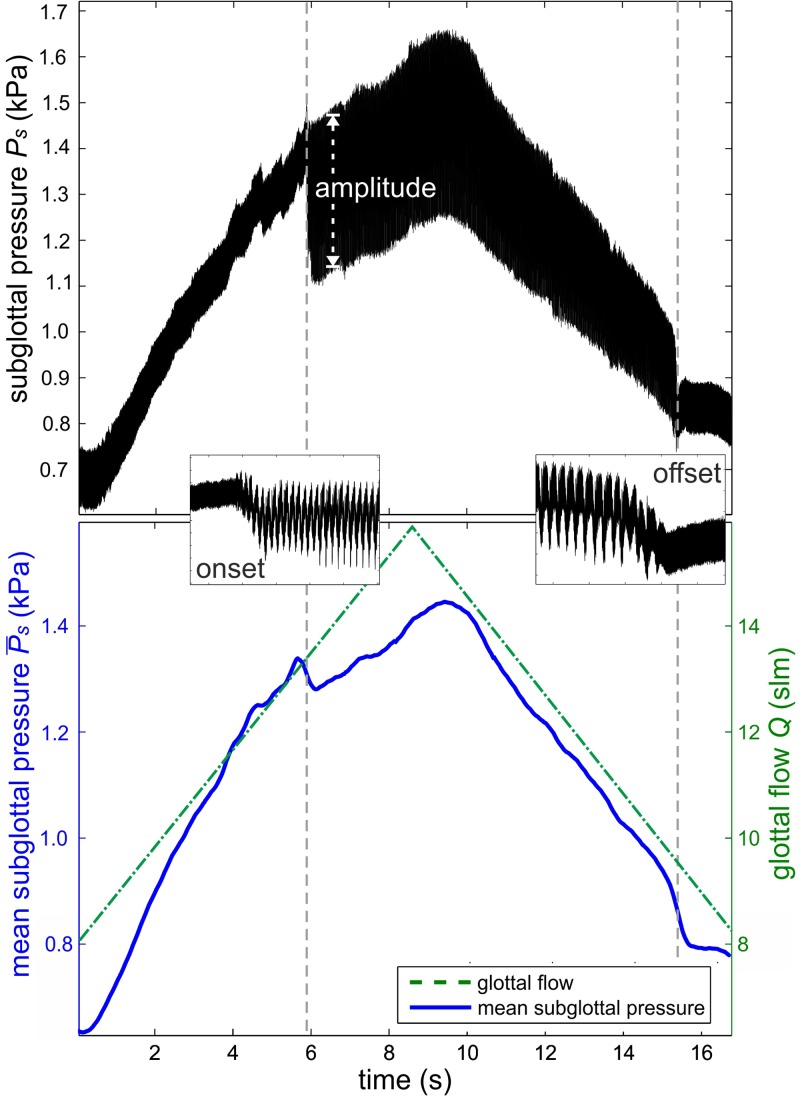
FIG. 10.
(Color online) (Top) Time resolved subglottal pressure signal at sequentially increasing/decreasing glottal flow. (Bottom) Mean subglottal pressure signal (solid line) and glottal flow (dashed line) as a function of time. The first vertical line depicts the time point of onset, the second line the time point of offset detection.

