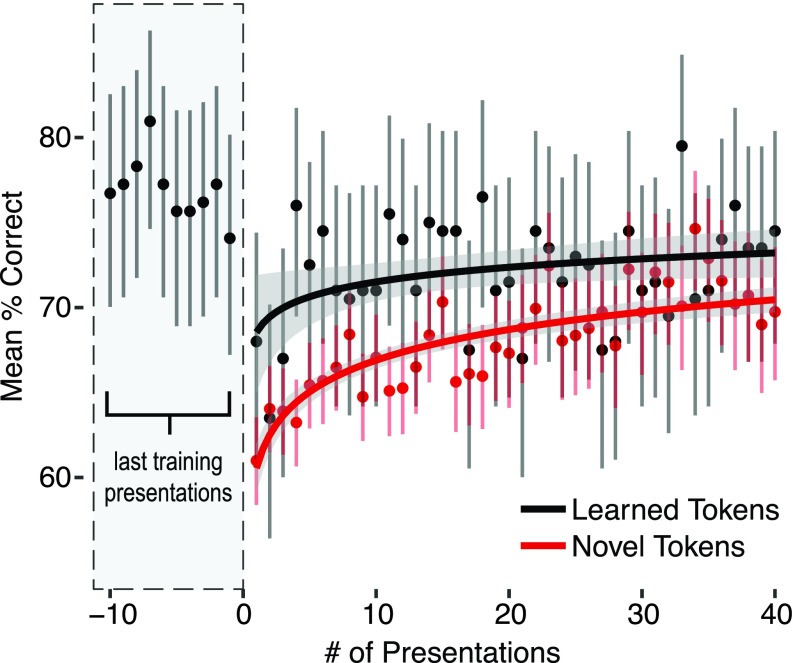
FIG. 3.
Learning curve for novel tokens. Performance for both novel and training set tokens dropped transiently and recovered similarly after the transition to the generalization stage. Presentation 0 corresponds to the transition to the generalization stage. The final ten trials before the transition are shown in the gray dashed box. Mean accuracy and 95% binomial confidence intervals are collapsed across mice for novel (red, all novelty classes combined) or learned (black) tokens, by number of presentations in the generalization task. Logistic regression of binomial correct/incorrect responses fit to log-transformed presentation number (lines, shading is smoothed standard error).

