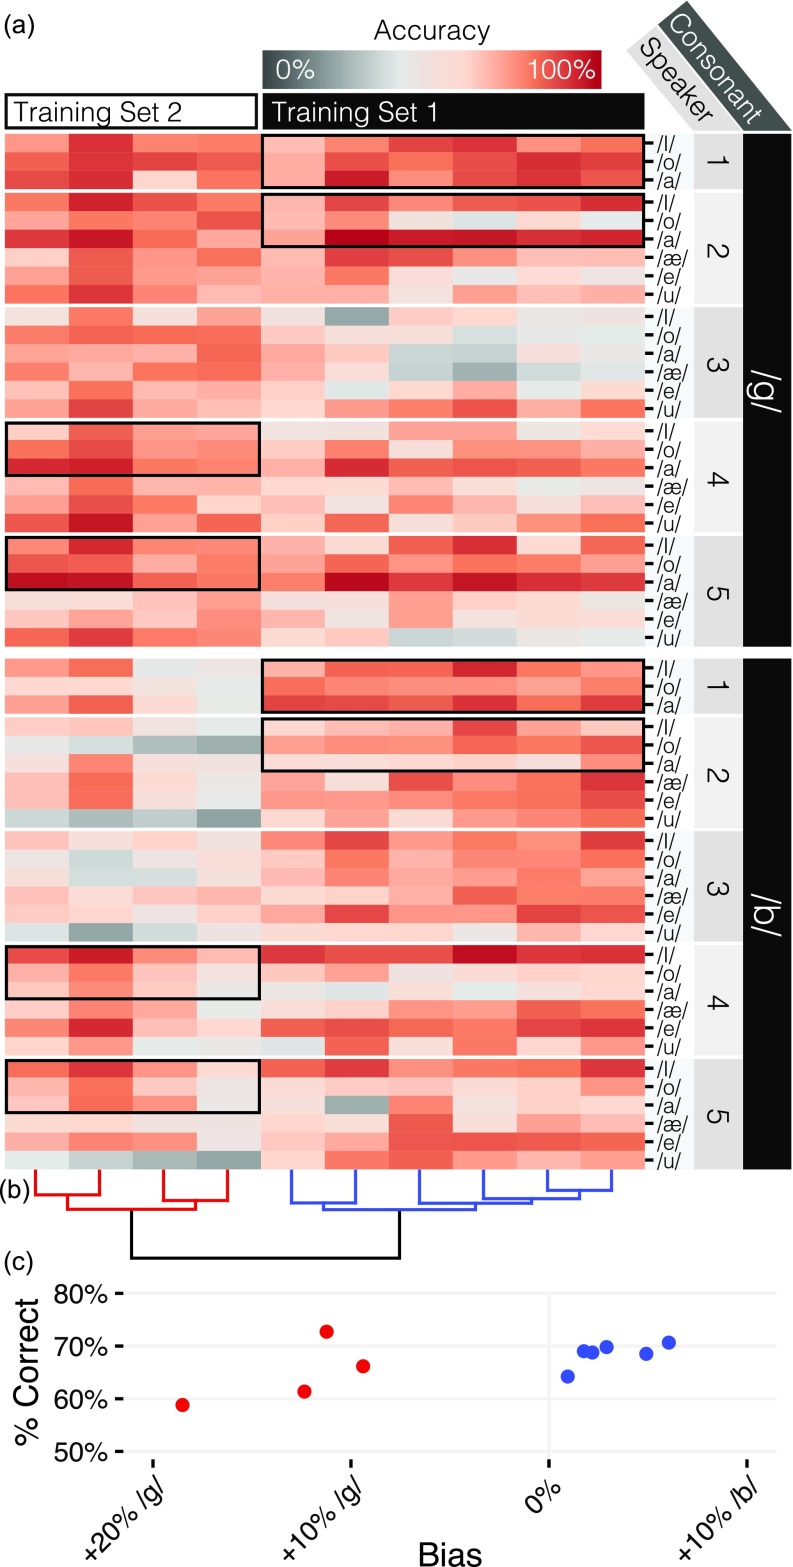
FIG. 4.
Patterns of individual and group variation. (a) Mean accuracy (color, scale at top) for each mouse (columns) on tokens grouped by consonant, speaker, and vowel (rows). The different training sets (cells outlined with black boxes) led to different patterns of accuracy on the generalization set. (b) Ward clustering dendrogram, colored by cluster. (c) Training set cohorts differed in bias but not mean accuracy.

