Figure 1.
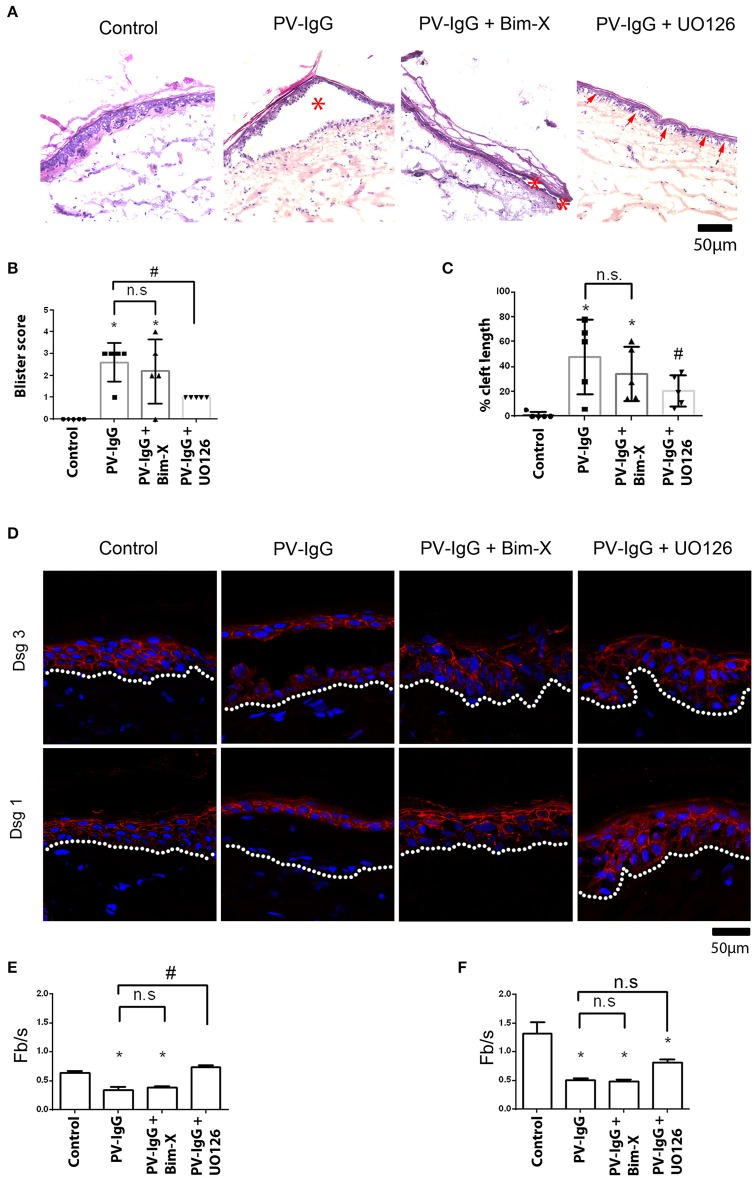
Histological analysis showing suprabasal cleft formation and Dsg3 depletion in skin explant culture. (A) HE staining, *shows blisters, whereas arrows show small cleft formation between basal cells. (B) Blister score represents the size of blisters formed, and (C) represents cleft length as percentage of the length of section. (D) Immunostaining with Dsg1 and Dsg3 antibodies. Dsg1 and 3 show a fragmented distribution in PV-IgG-treated cells and complete depletion of Dsg1 in blister floor. When UO126 was used in addition, Dsg1 staining was partially preserved. (E) Quantification of effects on Dsg1 localization. (F) Quantification of effects on Dsg3 localization. n = 3–5 for each condition Scale bar = 50 μm. *P < 0.05 vs. control, #P < 0.05 vs. PV-IgG.

