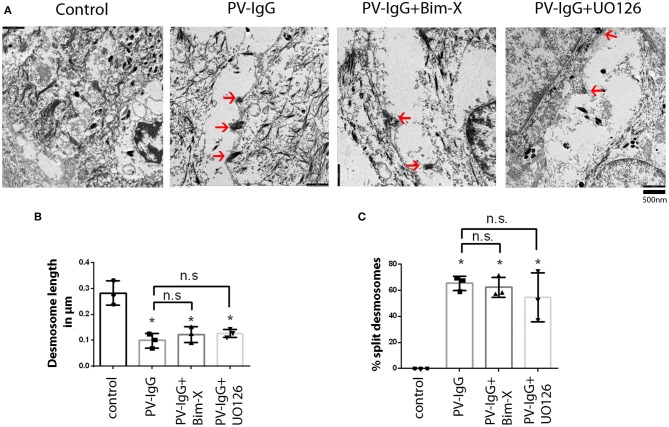
Figure 3.
Split desmosomes after incubation with PV-IgG. (A) Electron-micrograph of split desmosomes with reduced plaques as well as reduced keratin associations. Arrows indicate split desmosomes. Scale bar: 500 nm. (B) Length of split desmosomes as compared to normal controls. (C) Ratio of split desmosomes expressed as percentage of total desmosomes in the vicinity of blister. n = 3. *P < 0. 05 vs. control.

