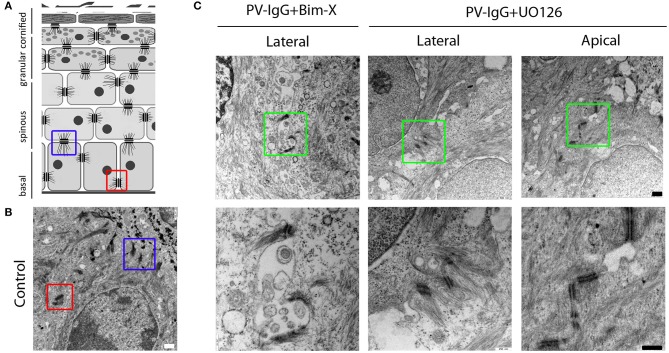
Figure 4.
Desmosome alterations at the lateral and apical interfaces of basal keratinocytes. (A,B) Schematic diagram and control electron-micrograph (scale bar 500nm) showing the apical (blue box) and lateral (red box) desmosomes. (C) Electron-micrographs of samples treated with PV-IgG with either Bim-X or UO126. Scale bars for upper and lower panels, 500 and 250 nm, respectively.

