
Figure 2.
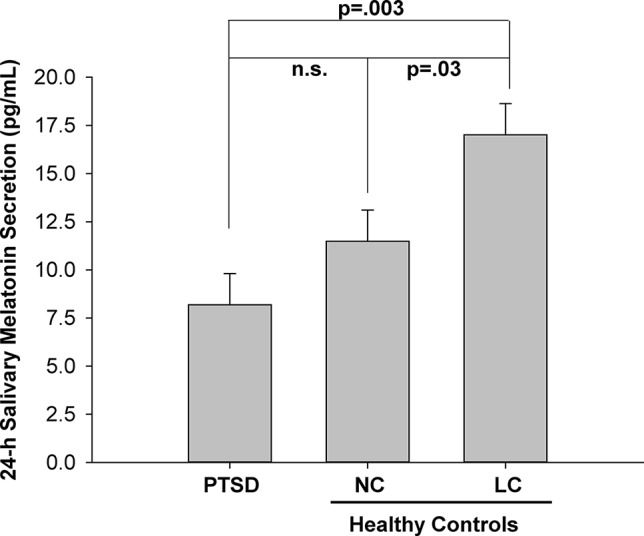
Mean melatonin concentration (pg/ml) for each of three groups: posttraumatic stress disorder (PTSD), normal controls (NC), and light controlled (LC). All values are means ± SEM.
Official websites use .gov
A
.gov website belongs to an official
government organization in the United States.
Secure .gov websites use HTTPS
A lock (
) or https:// means you've safely
connected to the .gov website. Share sensitive
information only on official, secure websites.
Mean melatonin concentration (pg/ml) for each of three groups: posttraumatic stress disorder (PTSD), normal controls (NC), and light controlled (LC). All values are means ± SEM.