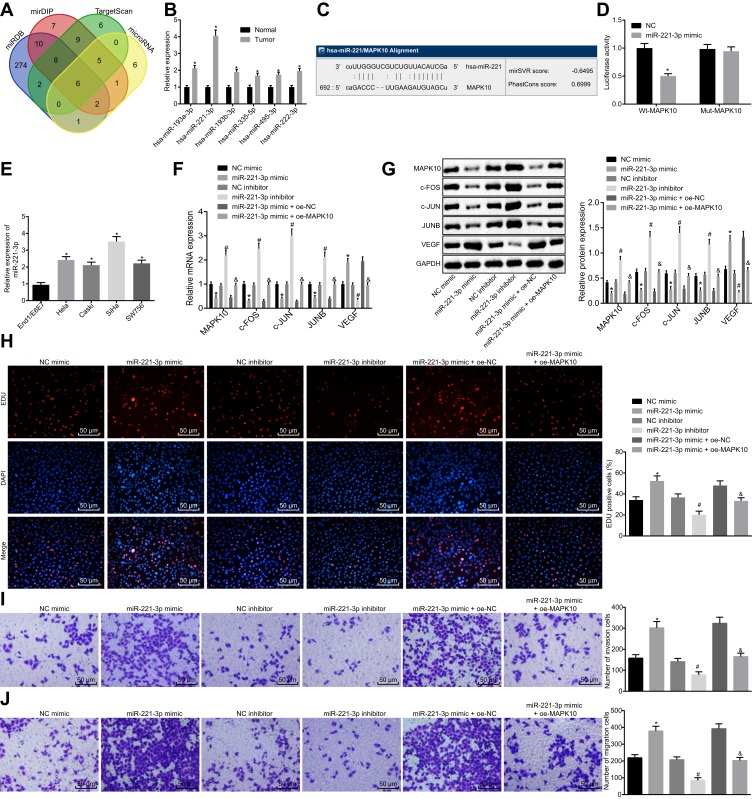
Figure 3.
miR-221-3p depletion inhibits cell proliferation, invasion and migration by increasing MAPK10 in cervical cancer. SiHa cells are transfected with miR-221-3p mimic, miR-221-3p inhibitor and oe-MAPK10 + miR-221-3p mimic. (A), Prediction of the upstream regulatory miRNAs of MAPK10. The 4 ellipses represent the predicted results from miRDB database, mirDIP database, TargetScan database and microRNA database, and the middle part represents the intersected results of the 4 databases. (B), Quantitatively analysis on expression of intersected 6 miRNAs in cervical cancer. *p < 0.05 vs the normal cervical tissues. (C), Website Prediction of the binding site between miR-221-3p and MAPK10. (D), The luciferase activity of PGLO-MAPK10 WT and PGLO-MAPK10 MUT in response to the transfection of miR-221-3p mimic detected by dual luciferase reporter gene essay. *p < 0.05 vs the transfection of NC. (E), The expression of miR-221-3p in cervical cancer cell lines (Hela, Caski, SiHa and SW756) and normal cervical epithelial cell line End1/E6E7 tested by RT-qPCR. *p < 0.05 vs normal cervical epithelial cell line End1/E6E7. (F), The mRNA expression of MAPK10, c-FOS, c-JUN, JUNB and VEGF in SiHa cells after transfection detected by RT-qPCR. (G), The protein expression of MAPK10, c-FOS, c-JUN, JUNB and VEGF in SiHa cells after transfection measured by Western blot analysis. (H), Cell viability (× 200) assessed by EdU assay. (I), Cell invasion ability (× 200) determined by Transwell assay. (J), Cell migration ability (× 200) identified by Transwell assay. *p < 0.05 vs SiHa cells transfected with NC mimic. # p < 0.05 vs SiHa cells transfected with NC inhibitor. & p < 0.05 vs SiHa cells transfected with miR-221-3p mimic + oe-NC. The above data are all documented measurement data. Comparisons between two groups were analyzed by non-paired t-test. One-way ANOVA was used for comparison among multiple groups, followed by Tukey’s post hoc test. The experiments are repeated 3 times independently.

