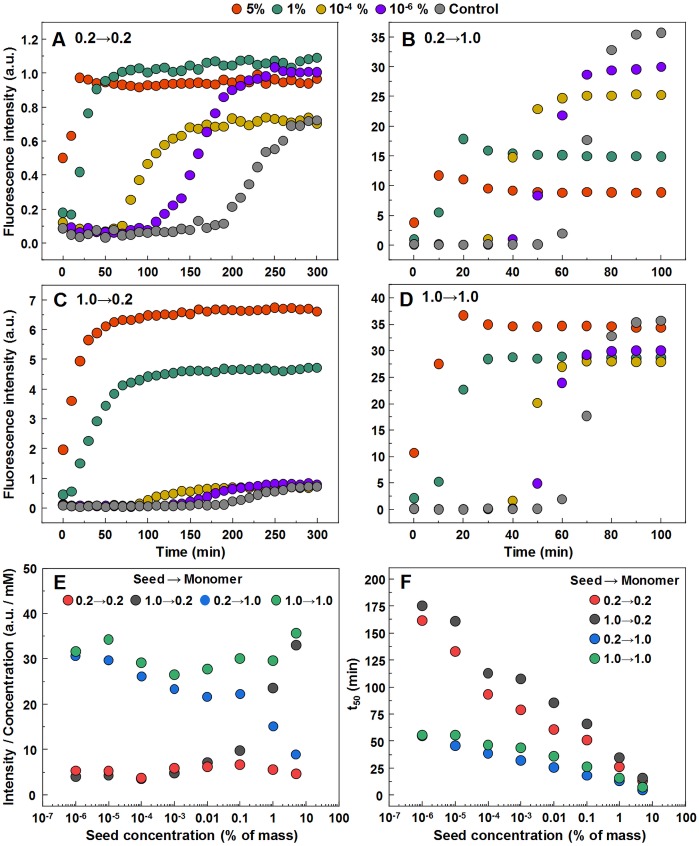
Figure 3. Seeded aggregation of insulin with a range of preformed fibrils.
Aggregation kinetics of insulin where the LCF are added to 0.2 mM insulin solutions (A), LCF to 1.0 mM (B), HCF to 0.2 mM (C) and HCF to 1.0 mM (D). Aggregation half-time (t50) dependence on concentration and type of seed added (E). ThT fluorescence intensity and fibril concentration ratio dependence on added seed concentration (F). Each data point is the average of four repeats.

