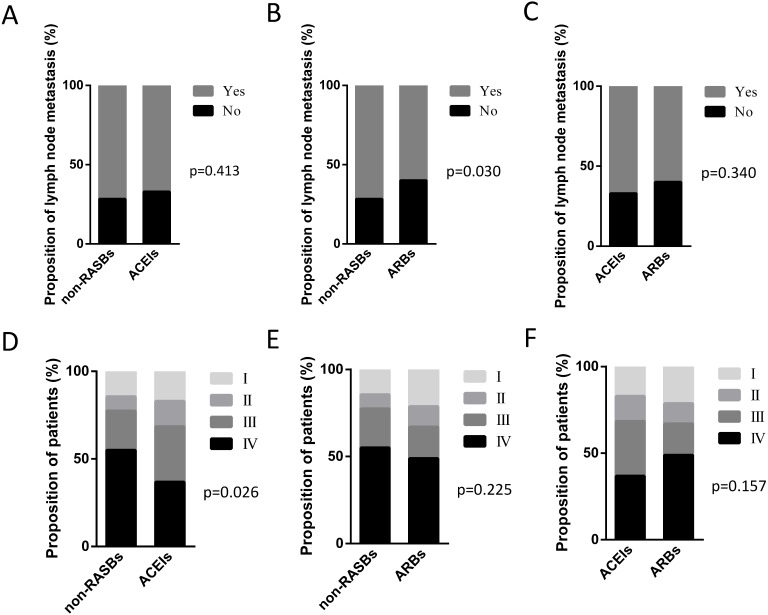
Figure 3. Graphical representations of the proportion of lymph node metastasis and pathological stage between the non-RASBs group and the ACEIs or ARBs group.
Comparison of lymph node metastasis between (A) the non-RASBs group and ACEIs group; (B) the non-RASBs group and ARBs group; (C) the ACEIs group and ARBs group. Comparison of the pathological stage between (D) the non-RASBs group and ACEIs group; (E) the non-RASBs group and ARBs group; (F) the ACEIs group and ARBs group. The statistical significance for difference of means is shown (P values, χ2 test or Fisher’s exact test).

