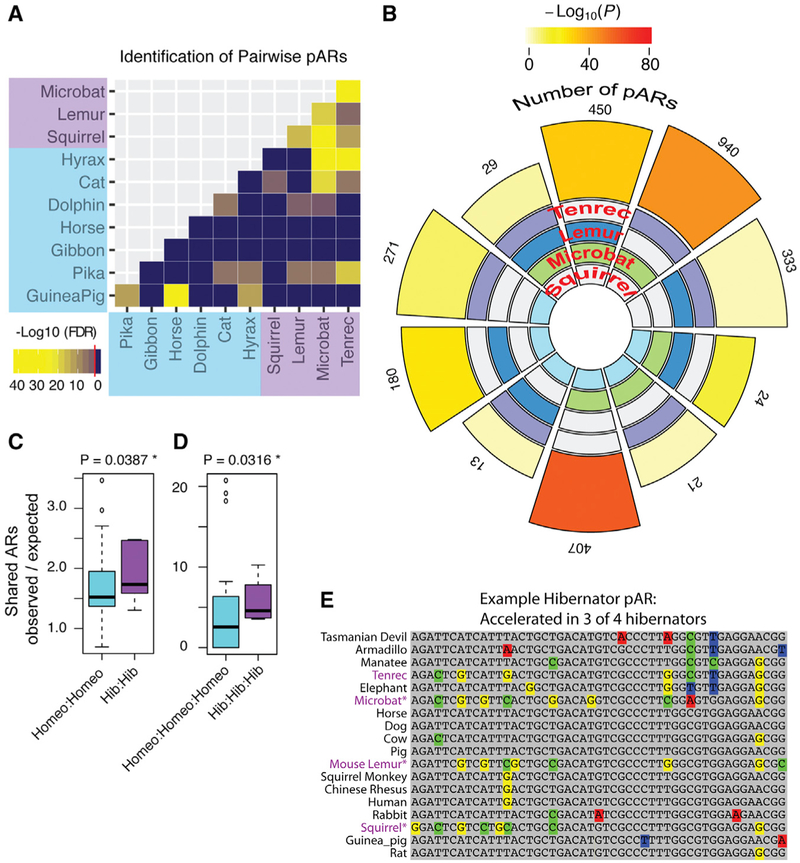
Figure 2. Discovery of Significant pARs in Distantly Related Hibernating Mammals.
(A) The heatmap shows the results of pairwise testing for significant numbers of shared ARs between different hibernating and/or non-hibernating species. The heatmap data are based on the log10-scaled Benjamin-Hochberg adjusted p value for the hypergeometric tests, and the red line in the legend indicates the threshold for significance (FDR 5%). All pairwise comparisons between hibernators are significant.
(B) The flower plot shows the number of pARs identified and significance of the overlap for each of the different hibernator species intersections. The statistical significance of each intersection is shown by the color of the outer segment of the plot according to the legend. All cases are statistically significant (log 10 p value shown; SuperExactTest package in R). The number of pARs discovered from each species intersection is indicated by the outer numbers and the size of the outer blocks. The species intersected in each comparison is shown by colored blocks on the inner region (tenrec, purple; lemur, dark blue; microbat, green; squirrel, light blue). The data show that all two-way and three-way intersections between hibernators yield significantly more pARs than expected by chance.
(C and D) The boxplot compares the number of two-way (C) and three-way (D) species pARs for the different hibernator (purple) versus non-hibernator (blue) species intersections (see Figure S2). The plot shows the number of observed pARs normalized to the number expected for each intersection. Hibernators have significantly more two-way and three-way pARs than non-hibernators after controlling for evolutionary distance. p values were computed using generalized linear modeling on a quasipoisson distribution and likelihood ratio test (see STAR Methods).
(E) An example of a significant triplet hibernator pAR. The 50-bp sequence is well conserved across non-hibernating mammals from humans to marsupials but significantly accelerated in the hibernating squirrel, mouse lemur, and microbat (purple text).

