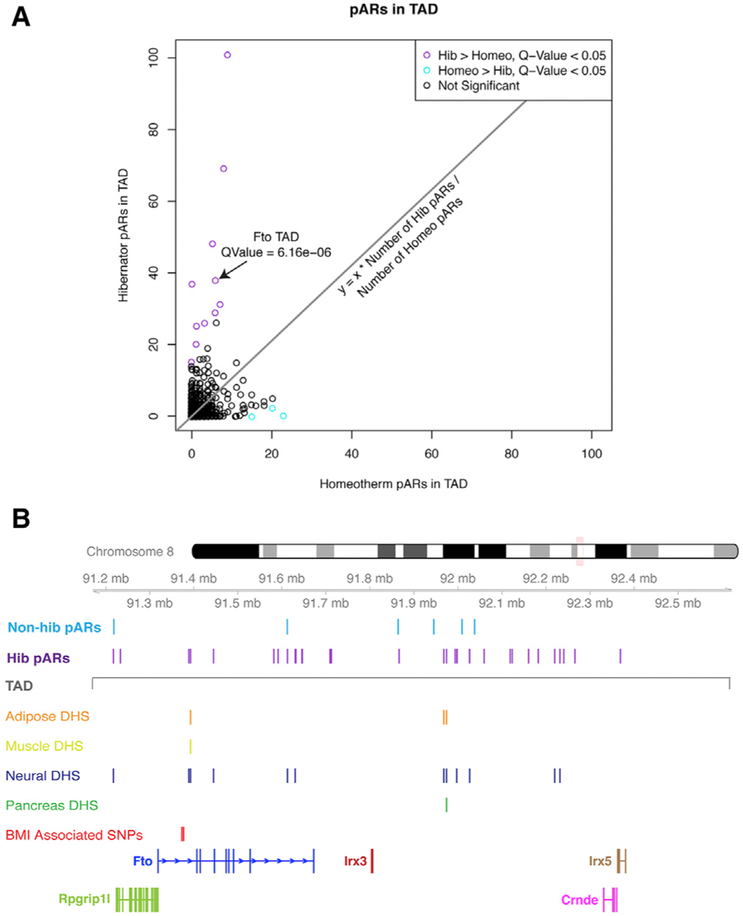
Figure 4. Identification of TADs in the Genome with Disproportionate Numbers of Hibernator pARs and Discovery that the FTO TAD Is among the Most Enriched Sites.
(A) The scatterplot shows the relative numbers of hibernator versus non-hibernator pARs in different TADs of the mouse genome. TADs significantly enriched for hibernator pARs are shown in purple (chi-square test; q-value < 0.05), those enriched for non-hibernator pARs are shown in cyan, and other TADs are shown in black (not significant). For each TAD, the numbers of hibernator pARs (y axis) versus non-hibernator pARs (x axis) are shown.
(B) The plot shows the locations of 38 hibernator (hib pARs) and 6 non-hibernator (non-hib pARs) pARs in the Fto TAD. The boundaries of the TAD are indicated (gray line). The tracks below indicates the DNase I hypersensitivity (DHS) of human homologs of the hibernator pARs in different tissues. The data reveal tissue-dependent activity patterns and many cis elements active in neural tissue. Multiple hibernator pARs lie in the first intron of Fto/FTO near known obesity risk variant sites in the first intron (BMI-associated SNPs: rs1421085 and rs1558902; red track), which can influence the expression of Irx3/IRX3 through long-range regulatory contacts.

