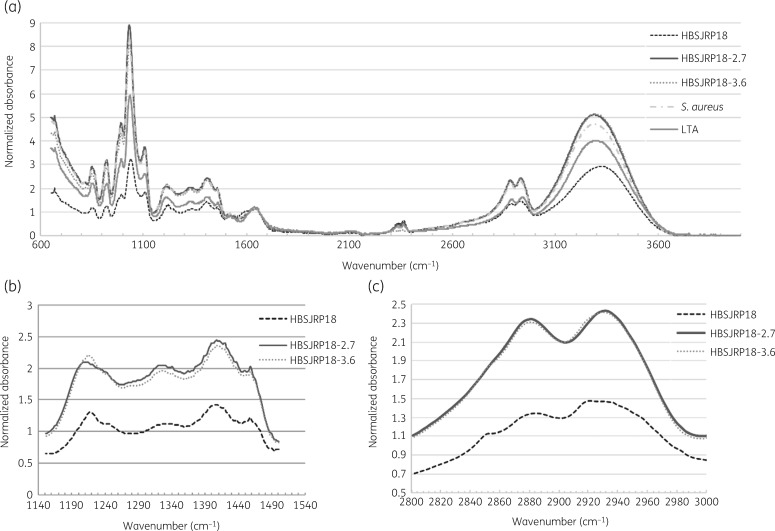
Figure 4.
FTIR spectra of LTA extracted from E. faecium HBSJRP18, its variants and S. aureus. (a) FTIR spectra of LTA extracted from E. faecium HBSJRP18, E. faecium HBSJRP18-2.7, E. faecium HBSJRP18-3.6 and S. aureus ATCC 25923 plus a commercial S. aureus-derived LTA (Sigma–Aldrich Inc.). (b) Spectrum region from wavenumber 1150 to 1500cm−1 comparing E. faecium HBSJRP18 and its variants E. faecium HBSJRP18-2.7 and E. faecium HBSJRP18-3.6. (c) Spectrum region from wavenumber 2800 to 3000cm−1 with all samples described before.

