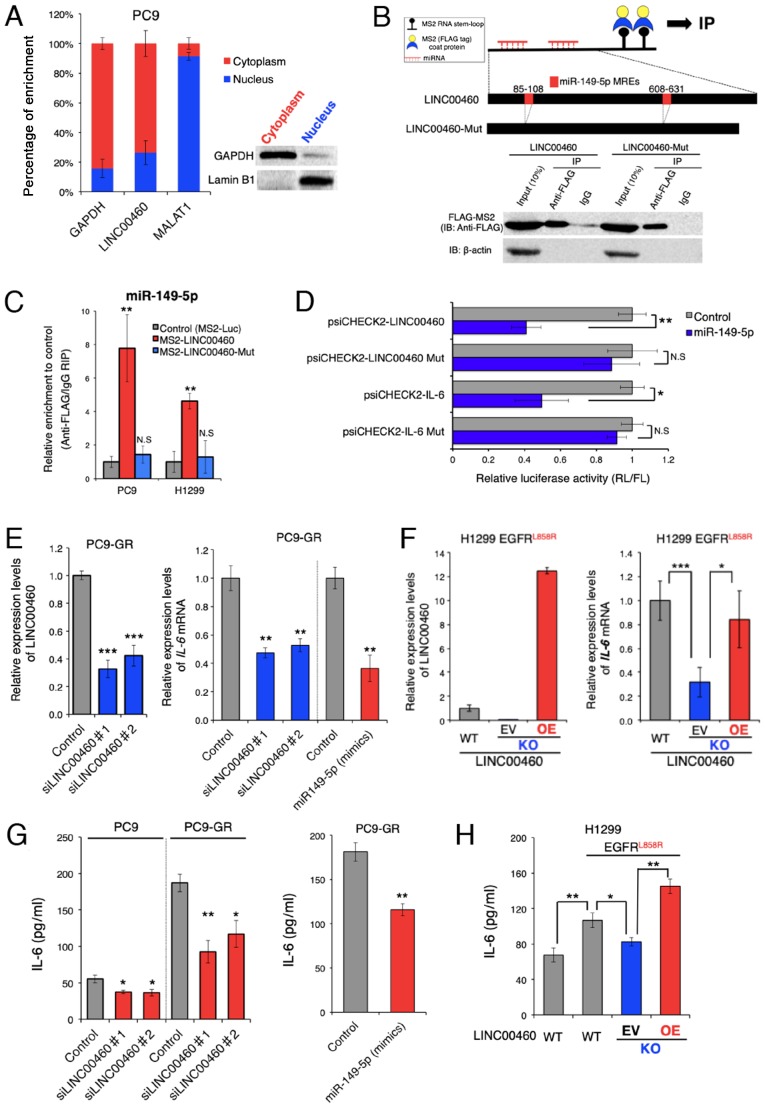
Figure 3.
LINC00460 transcripts function as a ceRNA for miR-149-5p in regulating IL-6 expression. (A) Cell nucleus/cytoplasm fractionation and RT-qPCR indicating the cellular distribution of LINC00460 in PC9 cells. GAPDH was used as a cytoplasm marker. MALAT1 and Lamin B1 were used as nucleus markers. Data are presented as the means ± SD (n=3). (B) Upper panel: Schematic of the binding 2X MS2 stem-loop fused bait RNA to MS2 coat proteins used for the RIP assay based on the miTRAP method and schematic outline of predicted binding sites for miR-149-5p on the LINC00460 sequence. Lower panel: Western blot analysis of FLAG-tag fused MS2 proteins isolated from PC9 input fractions or co-purified with (MS2-)LINC00460 and (MS2-)LINC00460 Mut (deletion mutant of the MREs), respectively. IgG served as a negative control for nonspecific pull downs. β-actin was used as an internal control. (C) MS2-based RIP assay with anti-FLAG antibody in PC9 or H1299 cells. The cells were incubated for 48 h following transfection with a MS2-FLAG plasmid, along with MS2-LINC00460, MS2-LINC00460 Mut, or MS2bs-Luc (control vectors). The results of RT-qPCR are presented as the means ± SD (n=3). (D) Relative luciferase activity of psiCHECK2-LINC00460, LINC00460 Mut, IL-6, and IL-6 Mut upon transfection with miR-149-5p mimics in H1299 cells. psiCHECK2-LINC00460 and psiCHECK2-IL-6 are psiCHECK2 vectors that contain LINC00460 and the 3'UTR of IL-6 mRNA, respectively. Mut stands for deletion mutant of miR-149-5p MREs. Data are presented as the ratio of Renilla luciferase activity (RL) to Firefly luciferase activity (FL). Error bars represent the means ± SD (n=3). (E) Relative expression levels of LINC00460 (left panel) and IL-6 mRNA (right panel) following transfection with control (si-Luc), si-LINC00460#1, and si-LINC00460#2. The results of RT-qPCR are presented as the means ± SD (n=3). (F) Left panel: Detection of LINC00460 in knockout (KO) clones by RT-qPCR. H1299 cells expressing EGFR L858R were transfected with the Cas9 plasmid vector for LINC00460 knockout. The KO cells were rescued by the LINC00460 expression vector. Right panel: Relative expression of IL-6 mRNA in the engineered H1299 cells. The results of RT-qPCR are presented as the means ± SD (n=3). (G and H) Concentrations of IL-6 (pg/ml) in cell culture supernatants were measured by ELISA. (G) Concentration of IL-6 in PC9 or PC9-GR following transfection with control (si-Luc), si-LINC00460#1, si-LINC00460#2 (left), and miR-149-5p mimics (right panel). (H) Concentration of IL-6 in engineered H1299 cells. WT, wild type; KO, knockout; EV, empty vector; OE, overexpression. The results of ELISA are presented as the means ± SD (n=3). The level of statistical significance was P-value set at <0.05 (*P<0.05, **P<0.01, ***P<0.001). n.s., not significant.

