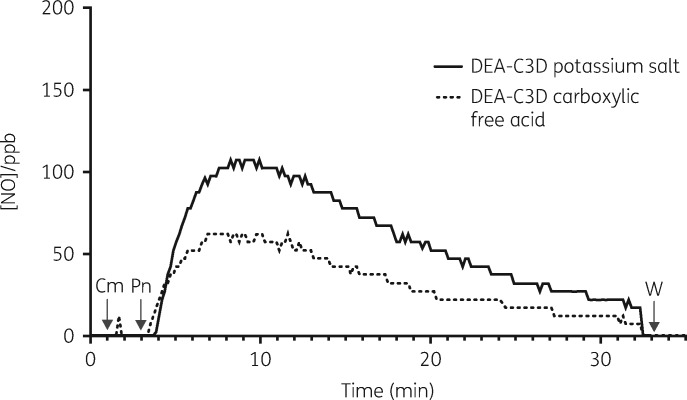
Figure 2.
Representative traces showing NO release from DEA-C3D (potassium salt and carboxylic acid) upon exposure to penicillinase. The release of NO was followed in real time by gas-phase chemiluminescence, with concentrations expressed in parts per billion (ppb). Arrows denote the time the compounds (Cm) and 20 U of B. cereus penicillinase (Pn) were added to the reaction chamber. Readings were discontinued 30 min after addition of penicillinase, at which time the reaction chamber was washed (W) and prepared for the next analysis. Experiments were carried out in duplicate and showed similar results.

