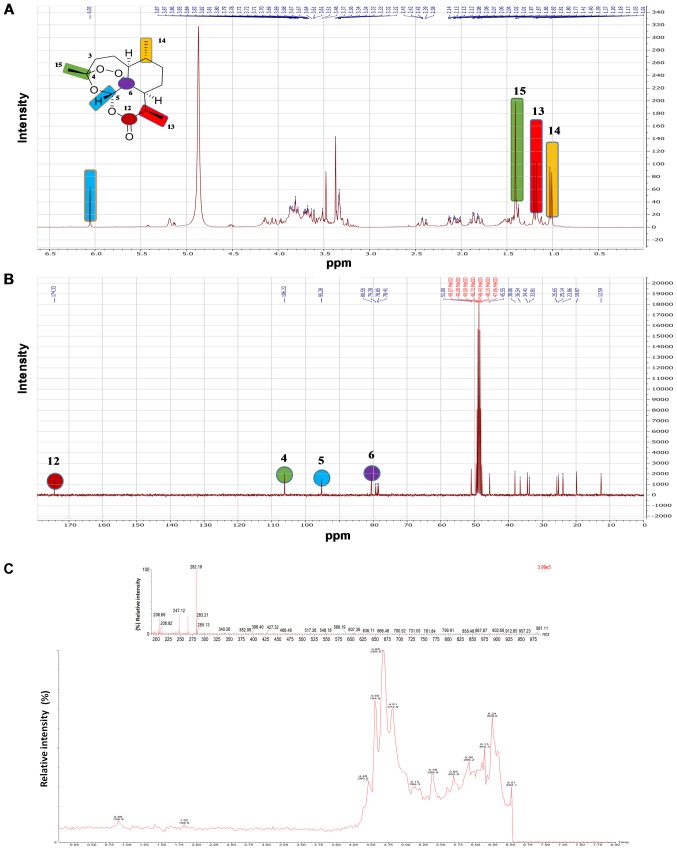
Figure 1.
NMR spectra of A. annua chloroform extract demonstrating the presence of artemisinin. (A) 1H NMR (300 MHz). (B) 13C NMR (75 MHz). (C) RP-HPLC/MS chromatogram of A. annua (Luparte®) extract. The top figure shows the MS profile, while the bottom figure represents the HPLC measurements. NMR, nuclear magnetic resonance; RP-HPLC/MS, reversed phase high-performance liquid chromatography-mass spectrometry.

