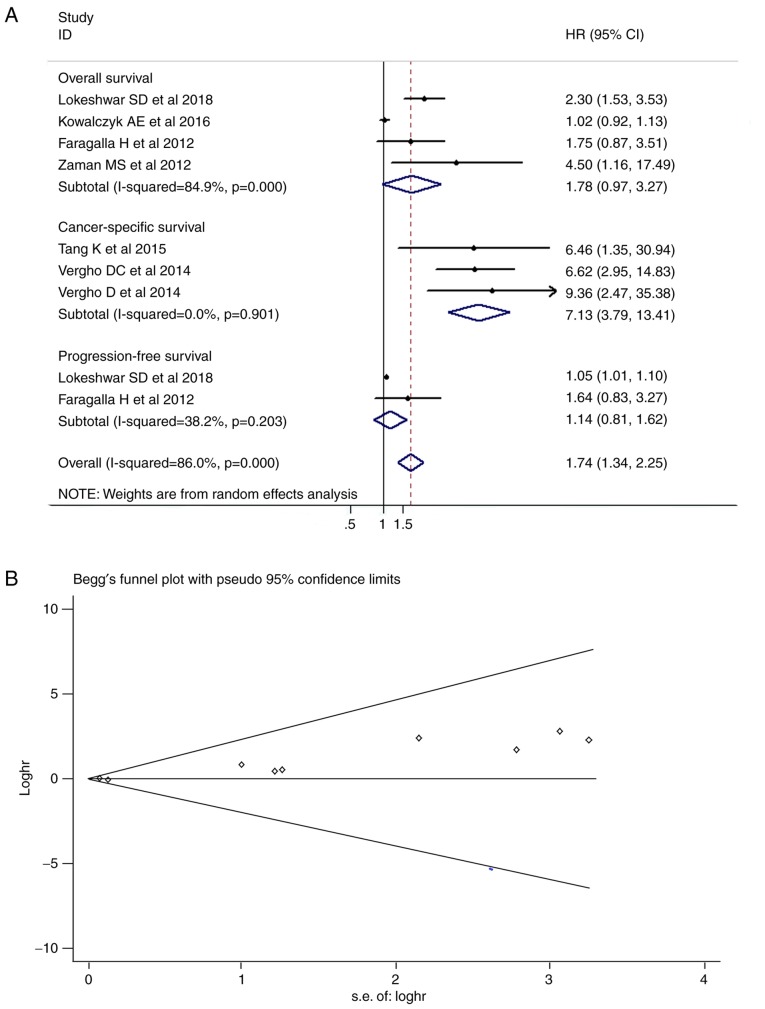
Figure 2.
Meta-analysis of miR-21 expression and survival of patients with RCC. (A) Forest plot and (B) funnel plot of the association between the miR-21 expression and survival of patients with RCC. Squares represent HR in each trial. The horizontal line crossing the square indicates the 95% CI. Diamonds represent the predicted pooled effect beneath the Mantel-Haenszel random-effects model. Visual inspection of the Begg's funnel plot identified slight asymmetry. HR, hazard ratio; CI, confidence interval; s.e., standard error.

