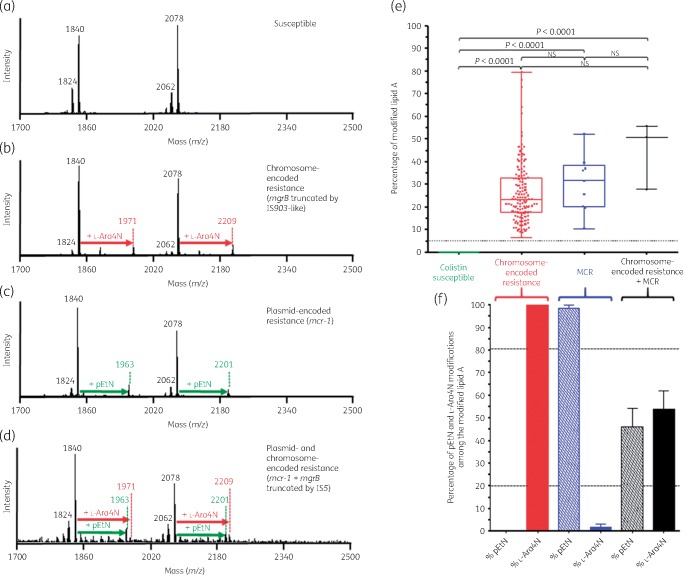
Figure 1.
Results of the optimized MALDIxin test on K. pneumoniae. Representative spectra of: (a) a polymyxin-susceptible K. pneumoniae isolate; (b) a chromosome-encoded (mgrB disruption) polymyxin-resistant K. pneumoniae isolate; (c) a polymyxin-resistant K. pneumoniae isolate producing MCR-1; and (d) a polymyxin-resistant K. pneumoniae harbouring both chromosome-encoded resistance (mgrB disruption) and plasmid-encoded MCR-1. The peaks at m/z 1824, 1840, 2062 and 2078 (black) correspond to the peaks of native K. pneumoniae lipid A, the peaks at m/z 1971 and 2209 (red) correspond to the addition of l-Ara4N to the native lipid A and the peaks at m/z 1963 and 2201 (green) correspond to the addition of one pEtN to the native lipid A. (e and f) Representation of the percentage of the modified lipid A for colistin-susceptible and colistin-resistant K. pneumoniae isolates. (e) The global percentage of modified lipid A (l-Ara4N+pEtN-modified lipid A/native lipid A) is represented for colistin-susceptible isolates (n=32), chromosome-encoded colistin-resistant K. pneumoniae isolates (n=45), MCR-producing colistin-resistant K. pneumoniae isolates (n=3) and the K. pneumoniae isolate harbouring both mechanisms (n=1). All experiments were performed in triplicate. The error bars represent the standard error of the mean and the dotted horizontal line corresponds to the suggested cut-off for colistin susceptibility related to no modification of lipid A. NS, not significant. (f) Representation of the percentage of l-Ara4N- and pEtN-modified lipid A among the global modified lipid A for colistin-resistant K. pneumoniae isolates. The dotted horizontal lines correspond to the proposed cut-offs for discriminating between chromosome-encoded resistance, MCR production and both mechanisms.

